
الوصف
**Vmm Signal Trend Pro - مؤشر لمنصة cTrader**
**الوصف العام**
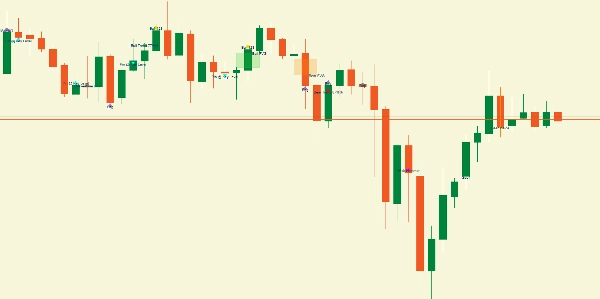
Vmm Signal Trend Pro هو مؤشر تحليل فني متقدم لمنصة cTrader يكتشف أنماط سعرية متعددة في الوقت الحقيقي. يجمع بين اكتشاف الاتجاه، أنماط الشموع، فجوات القيمة العادلة (FVGs)، الفجوات، وأنماط أخرى مهمة في مؤشر بصري واحد.
**الميزات الرئيسية**
**1. اكتشاف الاتجاه**
- **تحليل حركة السعر**: يحدد الاتجاهات من خلال حركة السعر خلال آخر N شمعة
- **قوة الاتجاه**: يحسب نسبة القوة بناءً على الزخم والبنية
- **أيقونات الاتجاه**: سهم أخضر (للأعلى) أو سهم أحمر (للأسفل) عندما يكون الاتجاه قويًا
**2. الأنماط المكتشفة**
**فجوة القيمة العادلة (FVG)**
- **FVG صاعدة**: عندما يكون الحد الأدنى الحالي > الحد الأعلى لشمعتيْن مضت
- **FVG هابطة**: عندما يكون الحد الأعلى الحالي < الحد الأدنى لشمعتيْن مضت
- **مناطق ملونة**: مستطيلات نصف شفافة (خضراء/برتقالية)
**الفجوات**
- **فجوة صاعدة**: فتح فوق الحد الأعلى السابق
- **فجوة هابطة**: فتح تحت الحد الأدنى السابق
- **التصوير**: مستطيلات صغيرة عند فتح الشمعة
**الشموع الداخلية**
- شمعة داخل نطاق الشمعة السابقة بالكامل
- التمييز بالألوان (أصفر/برتقالي) بناءً على الاتجاه
**نمط 123 (عكسي)**
- **نمط 123 صاعد**: ثلاث نقاط مع اختراق صاعد
- **نمط 123 هابط**: ثلاث نقاط مع اختراق هابط
- **الإشارة**: أيقونة دائرية ذهبية
**أنماط الفتيل**
- **شبيه بالمطرقة**: فتيل سفلي بارز
- **شبيه بنجمة مطلقة**: فتيل علوي بارز
- **الأيقونة**: نجمة أرجوانية
**شموع الدبوس**
- فتيل طويل (≥2x الجسم) مع جسم صغير
- اكتشاف المستويات الرئيسية القريبة
- **الأيقونات**: مثلثات لأعلى/لأسفل (سماوي)
**الابتلاع**
- **ابتلاع صاعد**: شمعة صاعدة تبتلع الشمعة الهابطة السابقة
- **ابتلاع هابط**: شمعة هابطة تبتلع الشمعة الصاعدة السابقة
- **الأيقونة**: ماسة بنفسجية
**الدوچي**
- جسم صغير جدًا (≤10% من النطاق الكلي بشكل افتراضي)
- أنواع خاصة: Gravestone, Dragonfly, Long-Legged
- **الأيقونة**: دائرة رمادية
**3. نظام الدعم/المقاومة**
- الكشف التلقائي عن القمم/القيعان المتأرجحة
- يأخذ في الاعتبار القرب من المستويات الرئيسية لزيادة الأهمية
**4. التصفية الذكية**
- **الحد حسب النوع**: الحد الأقصى لعدد الإشارات لكل فئة
- **تباعد زمني**: يتجنب الإشارات القريبة جدًا من بعضها
- **مرشح الاتجاه**: خيار للسماح/رفض إشارات عكس الاتجاه
- **الحد الأدنى للقوة**: يفلتر الإشارات الضعيفة
**المعلمات القابلة للتكوين**
**الأساسيات**
- `عرض اتجاه الاتجاه`: ينشط أسهم الاتجاه
- `فحص الشموع السابقة`: عدد الشموع للتحليل
- `عتبة قوة الاتجاه`: الحد الأدنى للنسبة لاعتبار الاتجاه قويًا
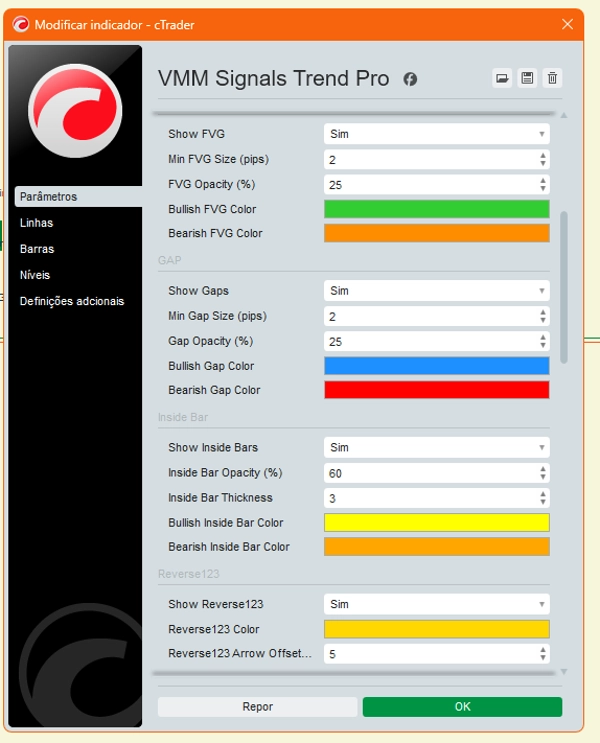
**FVG**
- `الحد الأدنى لحجم FVG`: الحد الأدنى للحجم بالنقاط
- `الشفافية`: شفافية المناطق
- `الألوان`: ألوان قابلة للتخصيص
**الفجوات**
- `الحد الأدنى لحجم الفجوة`: الحد الأدنى للحجم بالنقاط
- `الألوان`: ألوان للفجوات الصاعدة/الهابطة
**الشموع الداخلية**
- `السماكة`: سماكة الخط
- الشفافية: مستوى الشفافية
- الألوان: ألوان مميزة حسب الاتجاه
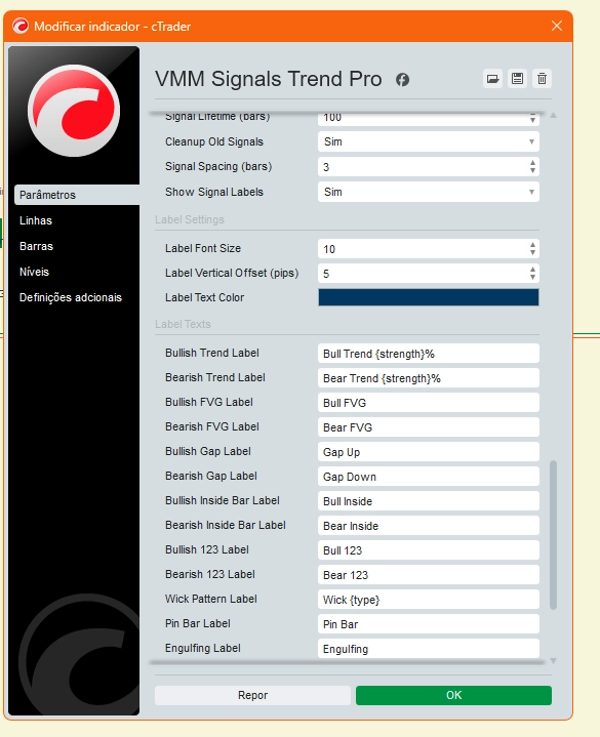
الإشارات:
- مدة الإشارة: مدة الإشارة (بالشموع)
- تباعد الإشارات: الحد الأدنى للتباعد بين الإشارات
- الحد الأقصى للإشارات لكل نوع: حد لكل فئة
التسميات المخصصة:
- نص قابل للتخصيص: لكل نمط نص قابل للتكوين
- العناصر النائبة: `{strength}` لقوة النسبة المئوية، `{type}` للنوع المحدد
- التنسيق: حجم الخط، الإزاحة الرأسية، الألوان
- الوضع المختصر: تسميات مختصرة للرسوم البيانية الكثيفة
الآليات الداخلية:
1. تحليل الاتجاه:
- الانحدار الخطي: يحسب ميل الاتجاه
- عدد الشموع: صاعدة مقابل هابطة خلال آخر N فترة
- الزخم: يأخذ في الاعتبار حجم الحركات
2. إدارة الكائنات**
- **ذاكرة الكائنات**: يمنع إعادة رسم الإشارات الموجودة
- **تنظيف تلقائي**: يزيل الإشارات القديمة بناءً على مدة الحياة
- **عدادات حسب النوع**: تتحكم في الكمية القصوى
**3. **حساب القوة**
- لكل نمط صيغة قوة محددة
- بناءً على النسب، المسافات بالنقاط، القرب من المستويات الرئيسية
- النطاق: 0-100%
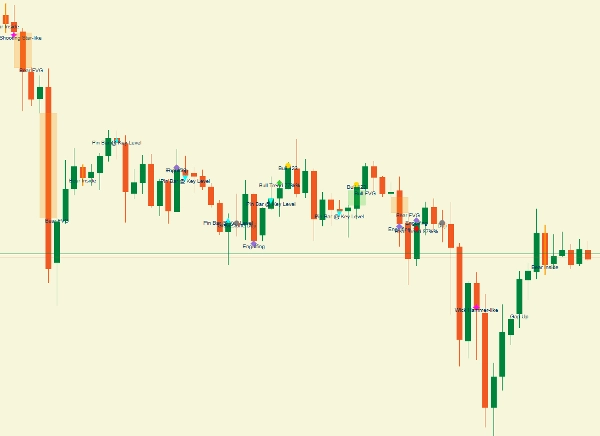
**تصوير الرسم البياني**
**عناصر الرسم البياني**
1. **الأيقونات**: أسهم، مثلثات، دوائر، ماسات، نجوم
2. **المناطق**: مستطيلات نصف شفافة (FVG/الفجوات)
3. **الخطوط**: تمييز الشموع الداخلية
4. **التسميات**: نصوص معلوماتية بجانب الإشارات
**رموز الألوان**
- **الأخضر**: صاعد (الاتجاه، FVG، الفجوات)
- **الأحمر/البرتقالي**: هابط (الاتجاه، FVG، الفجوات)
- **الأصفر/البرتقالي**: الشموع الداخلية (صاعدة/هابطة)
- **الذهبي**: نمط 123
- **الأرجواني**: أنماط الفتيل
- **السماوي**: شموع الدبوس
- **البنفسجي**: الابتلاع
- **الرمادي**: الدوچي
**المزايا**
**للمتداولين**
- **الكل في واحد**: أنماط متعددة في مؤشر واحد
- **قابل للتخصيص**: ضبط دقيق لكل نمط
- **رؤية واضحة**: ترميز لوني بديهي
- **تصفية**: يمنع تحميل الإشارات
**حالات الاستخدام**
**1. التحليل السريع**
- تحديد الاتجاه السائد
- فحص فجوات القيمة العادلة والفجوات الأخيرة
- اكتشاف أنماط الانعكاس
**2. تأكيد الدخول**
- دمج أنماط متعددة لزيادة الاحتمالية
- التحقق من التوافق مع الاتجاه
- النظر في قوة الإشارة
**3. إدارة المخاطر**
- تحديد مستويات الدعم/المقاومة القريبة
- استخدام فجوات القيمة العادلة كمناطق اهتمام
- النظر في تباعد الإشارات
**القيود**
**الاعتمادات**
- **الأسواق المتقلبة**: قد تولد العديد من الإشارات
- **الأطر الزمنية**: قد تحتاج الإعدادات إلى تعديل حسب الإطار الزمني
- **الأصول**: يختلف السلوك حسب زوج العملات
**الاعتبارات**
- **ليس تنبؤيًا**: الأنماط الماضية ≠ ضمان للمستقبل
- **يتطلب تأكيدًا**: دائمًا أكد بالتحليل الإضافي
- **إشارات خاطئة**: الفلاتر تقلل لكنها لا تلغي
**توصيات الاستخدام**
**الإعدادات الأولية**
1. ابدأ بـ `التصفية الذكية = true`
2. اضبط `الحد الأدنى لقوة الإشارة` حسب أسلوبك
3. استخدم `تباعد الإشارات` لتجنب التحميل الزائد
4. خصص الألوان لتحسين الرؤية
**التوليفات الفعالة**
- **الاتجاه + FVG**: توافق قوي
- **شمعة داخلية + مستوى رئيسي**: منطقة دخول جيدة
- **شمعة دبوس + ابتلاع**: تأكيد انعكاس
- **123 + الاتجاه**: استمرار محتمل
**المراقبة**
- تحقق من السجلات في وحدة التحكم بشكل دوري
- اضبط المعلمات حسب السوق
- استخدمه مع مؤشرات أخرى
هذا المؤشر هو أداة كاملة للمتداولين الباحثين عن تحليل فني شامل يركز على حركة السعر والأنماط البصرية، ويقدم مرونة تامة في تخصيص وتصفية الإشارات.
**⚠️ إخلاء المسؤولية الهام**
هذا المؤشر هو أداة تحليل فني. الإشارات المولدة هي اقتراحات بناءً على خوارزميات، وليست توصيات استثمارية. التداول ينطوي على مخاطر كبيرة من الخسارة. الأداء السابق لا يضمن النتائج المستقبلية. المتداول يتحمل المسؤولية الكاملة عن جميع قرارات التداول. استخدم دائمًا إدارة مخاطر مناسبة وجرب على حسابات تجريبية قبل التداول الحقيقي.


