
الوصف
Meravith Auto هو نسخة مؤتمتة من نظام التداول اليدوي Meravith.
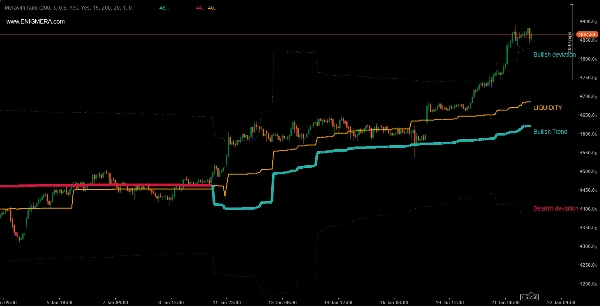
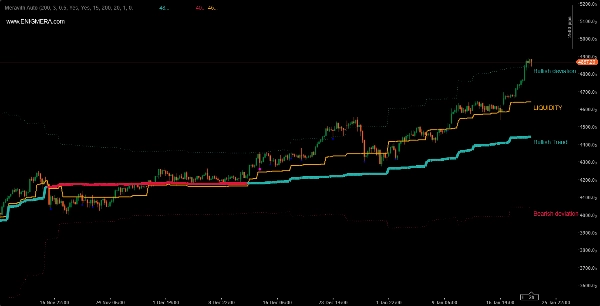
المؤشر يتكون من:
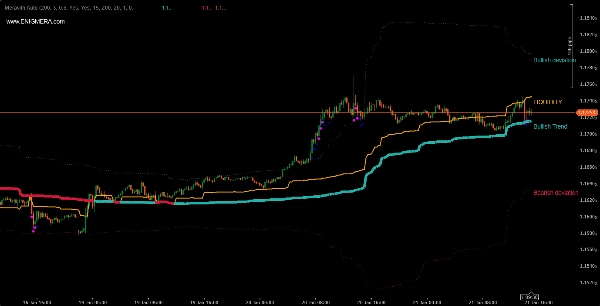
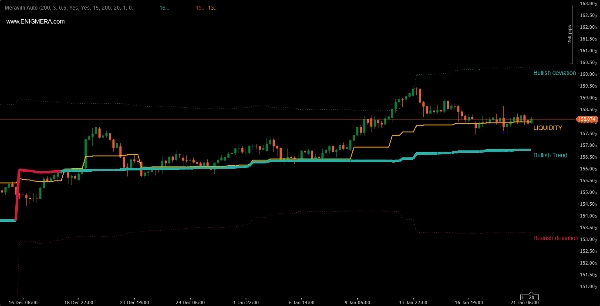
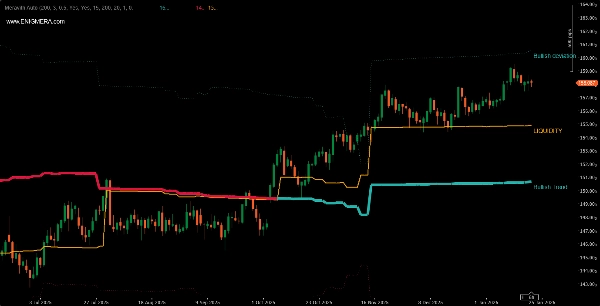
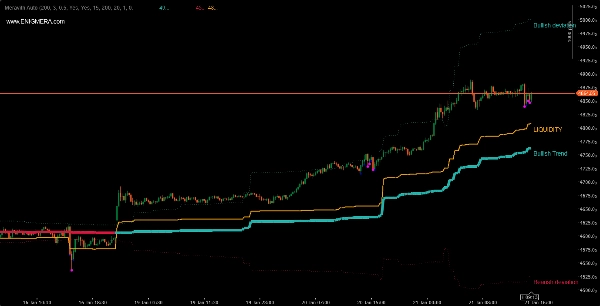
- خط الاتجاه الذي يغير لونه. عندما يكون صاعدًا يكون أخضر، وعندما يكون هابطًا يكون أحمر. هذا هو خط دعم الاتجاه.
- خط السيولة، حيث يكون حجم الشراء مساويًا لحجم البيع.
- خط انحراف صعودي ثلاثي.
- خط انحراف هبوطي ثلاثي.
- نقاط بنفسجية وزرقاء تشير إلى حجم مرتفع. النقطة البنفسجية تشير إلى حجم أكبر بانحرافين عن متوسط الحجم، والنقطة الزرقاء بانحرافين.
كيف تستخدمه؟
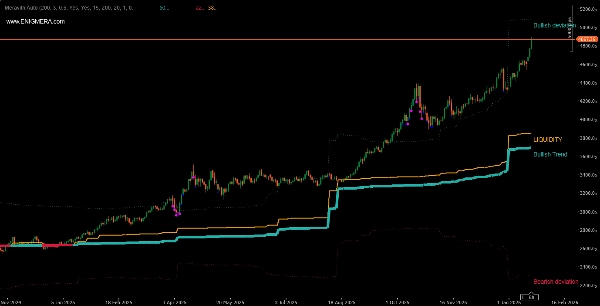
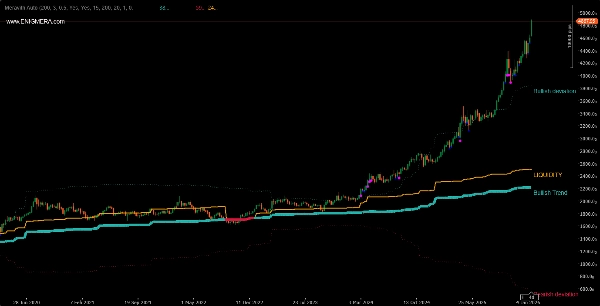
- خط الاتجاه الصاعد بالإضافة إلى السيولة فوق خط الاتجاه تعني اتجاهًا صاعدًا. نتوقع أن يتحرك السوق صعودًا. نفتح مراكز شراء.
- خط الاتجاه الهابط بالإضافة إلى السيولة تحت خط الاتجاه تعني اتجاهًا هابطًا. نتوقع أن يتحرك السوق هبوطًا. نفتح مراكز بيع.
ادمجه حسب تقديرك مع مؤشرات أخرى.
يمكن استخدامه على أي زوج وأي إطار زمني.
قد ترى نتائج مختلفة مع وسطاء مختلفين بسبب حجم التداول الذي يقتبسونه.
الوسطاء الأكبر مفضلون بسبب حجم التداول الأعلى.
ما الفرق بين النسخة المؤتمتة واليدوية؟
- في النسخة اليدوية، لدينا تقييم للاتجاه بناءً على القمم والقيعان. وبناءً عليه، يوفر أيضًا مستويات استنفاد الحجم في السوق.
- في النسخة المؤتمتة، لدينا فترة تتغير عبر مراحل السوق المختلفة. يمكن أن تختلف، حيث تكون قصيرة خلال التقلبات العالية وطويلة خلال التقلبات المنخفضة. هنا لا توجد مستويات استنفاد، لأن الاتجاه لا يتم تحليله، بل الفترة. هذا هو السبب في وجود الانحرافات. بشكل افتراضي، يتم عرض الانحراف الثلاثي.
الملخص
ملف تعريف المؤشر
تقييمات العملاء
0.0
التقييمات: 0
تقييمات العملاء
لا توجد تقييمات لهذا المنتج حتى الآن. هل جرَّبته بالفعل؟ كن أول من يخبر الآخرين!
مناقشة
الأسئلة الشائعة
BTCUSD
Forex
Signal
Breakout
Indices
EURUSD
Commodities
GBPUSD
NZDUSD
Prop
Scalping
Crypto
Stocks
XAUUSD
NAS100
USDJPY
VWAP
يتم توفير المنتجات المتاحة من خلال cTrader Store، بما في ذلك روبوتات التداول والمؤشرات والإضافات، من قبل مطوري الطرف الثالث وإتاحتها لأغراض الوصول المعلوماتي والفني فقط. cTrader Store ليس وسيطًا ولا يقدم نصائح استثمارية أو توصيات شخصية أو أي ضمان للأداء المستقبلي.


السعر
منذ 24/10/2025