
설명
SmartTrendScanner
개요
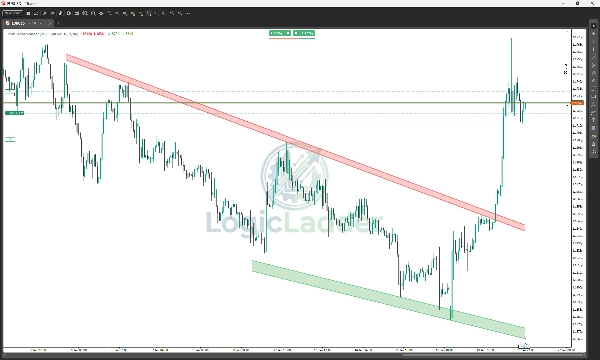
SmartTrendScanner는 추세 분석이라는 주관적인 예술을 자동화하기 위해 설계된 전문가용 cTrader 지표입니다. 얇고 단일 가격 추세선을 그리는 전통적인 지표와 달리, SmartTrendScanner는 동적인 수요 및 공급 클라우드 존을 식별하고 시각화합니다.
"최적 적합" 알고리즘으로 구동되며, 과거 가격 움직임을 스캔하여 가장 수학적으로 중요한 연결 지점을 찾아내고, 지지와 저항의 진정한 영역을 나타내는 채워진 채널을 그립니다.
주요 기능
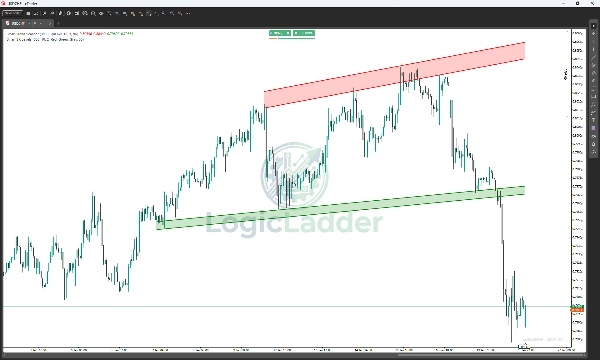
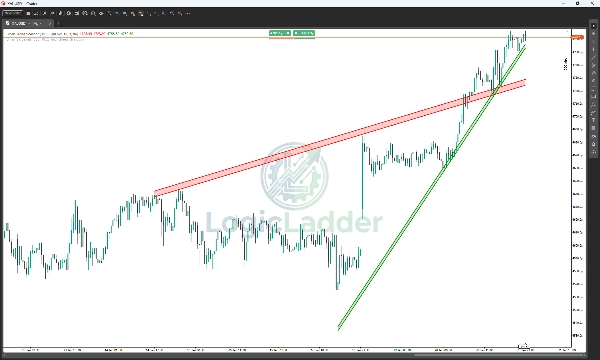
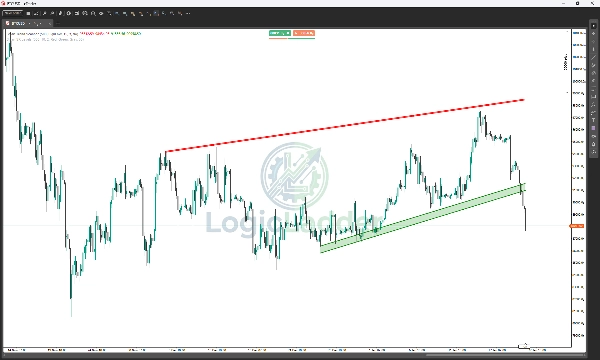
- 동적 클라우드 존: 얇은 선을 채워진 "클라우드" 채널로 대체하여 가격 터치 범위 전체(꼬리와 몸통)를 시각적으로 덮어 가짜 신호를 방지합니다.
- 지능형 피벗 감지: 사용자 맞춤 감도 설정에 따라 주요 스윙 고점과 저점을 자동으로 식별합니다.
- 최적 적합 알고리즘: 지표는 백그라운드에서 수천 개의 잠재적 추세선을 생성하고 필터링하여 현재 가격에 가장 가까운 가장 강력하고 존중받는 존만 표시합니다.
- 안정성 필터: 내장된 논리로 구조 파손을 검사하여 유효하지 않거나 오래된 레벨에서 거래하지 않도록 보장합니다.
- 실시간 알림: 움직임을 놓치지 마세요. 가격이 존을 돌파하거나 레벨을 재시험할 때 즉시 팝업 및 사운드 알림을 받습니다.
- 완전한 사용자 정의 가능: 클라우드 투명도, 색상, 피벗 강도 및 과거 기록을 조정하여 스캘핑, 데이 트레이딩 또는 스윙 등 거래 스타일에 맞출 수 있습니다.
작동 방식
- 과거 스캔: 지표는 사용자가 정의한 바 수(예: 300개 바)를 되돌아보며 프랙탈 피벗 포인트를 찾습니다.
- 점 연결: 피벗 간 연결을 테스트하여 유효한 추세 기울기를 찾습니다.
- 존 검증: 가격이 최근에 충분히 (최소 터치 수) 예상 선을 "터치"했는지, 그리고 크게 깨지지 않았는지 확인합니다.
- 클라우드 그리기: 유효한 추세가 발견되면 가장 높은 꼬리 터치와 가장 낮은 몸통 터치 사이에 투명한 클라우드를 그려 "행동 존"을 만듭니다.
설정 가이드
- 적용 바 수: 스캐너가 과거를 얼마나 되돌아보는지 (기본값: 300). 장기 스윙 트레이딩을 위해 이 값을 늘리세요.
- 피벗 강도: 프랙탈 감도의 민감도. 높은 숫자(예: 15 이상)는 주요 구조적 포인트를 찾고, 낮은 숫자(예: 5)는 내부의 작은 구조를 찾습니다.
- 최소 피벗 확인: 존이 유효하다고 간주되기 위해 가격이 존을 터치해야 하는 최소 횟수입니다.
- 존 투명도: 채우기 색상의 불투명도를 제어합니다 (0 = 보이지 않음, 255 = 불투명).
왜 LogicLadder인가?
거래는 확실성이 아니라 확률에 관한 것입니다. 지지와 저항을 얇은 선이 아닌 존으로 시각화함으로써, SmartTrendScanner는 진짜 유동성이 숨겨진 곳을 보여주어 군중보다 한 발 앞서 나갈 수 있도록 도와줍니다.
요약
AI 요약
Smart Trend Scanner is a professional-grade indicator for the cTrader platform that automates trend analysis by identifying and visualizing dynamic supply and demand zones as filled cloud channels rather than traditional thin trendlines. Using a "Best-Fit" algorithm, it scans historical price data to detect key swing highs and lows, connecting these pivot points to form mathematically significant support and resistance zones. The indicator validates zones by confirming multiple price touches without significant recent breaks, then draws transparent clouds between the highest wick and lowest body touches to represent true areas of market interest.
Key features include dynamic cloud zones that cover the full price range to reduce false signals, intelligent pivot detection adjustable by sensitivity, stability filters to avoid outdated levels, and real-time alerts for breakouts or retests. Users can customize settings such as lookback period, pivot strength, minimum touches for zone validation, and cloud transparency to suit various trading styles including scalping, day trading, and swing trading.
Smart Trend Scanner supports multiple markets including Forex, commodities, stocks, and cryptocurrencies, with symbol tags like BTCUSD, EURUSD, GBPUSD, XAUUSD, and NAS100. It aims to provide clearer visualization of liquidity zones to assist traders in making informed decisions based on probabilistic support and resistance areas.
지표 프로필
고객 리뷰
0.0
리뷰: 0
고객 리뷰
이 상품에 대한 리뷰가 아직 없습니다. 이미 사용해 보셨나요? 다른 사람들에게 가장 먼저 소개해 주세요!
상담
자주 묻는 질문(FAQ)
BTCUSD
Forex
EURUSD
Commodities
GBPUSD
NZDUSD
Prop
Scalping
Crypto
Stocks
XAUUSD
NAS100
USDJPY
트레이딩 봇, 지표, 플러그인 등 cTrader Store에서 제공되는 상품은 제3자 개발자에 의해 제공되며, 이는 단순히 정보 및 기술적 접근을 목적으로 제공된 것입니다. cTrader Store는 중개인이 아니며, 투자 조언, 개인별 추천 또는 향후 성과에 대한 어떠한 보장도 제공하지 않습니다.
이 작성자의 상품 더 보기


가격
가입일 09/01/2026
704
무료 설치