Beschreibung
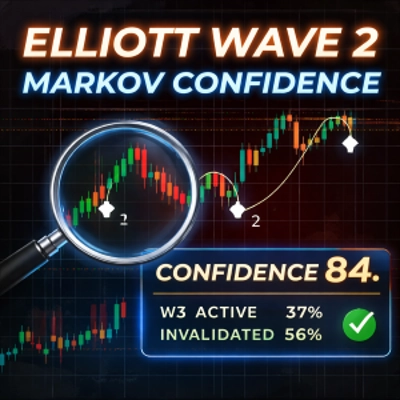
Elliott CLEAN — Wave2 + Markov Confidence
Elliott CLEAN ist ein fortschrittlicher analytischer Indikator, der Tradern hilft, Elliott-Welle-2-Setups zu identifizieren, zu validieren und zu verwalten, indem eine Kombination aus Marktstruktur und statistischer Wahrscheinlichkeit verwendet wird.
Anstatt die Kursrichtung vorherzusagen, konzentriert sich der Indikator auf strukturelle Übergänge und beantwortet eine nützlichere Frage:
Wie wahrscheinlich ist es, dass sich eine Welle 2 zu einer gültigen und nachhaltigen Welle 3 entwickelt – und wie viel Vertrauen sollte der Trader in dieses Szenario haben?
Was dieser Indikator tut
Elliott CLEAN erkennt automatisch:
- Wave-1- bis Wave-2-Strukturen basierend auf Swing-Pivots
- Definiert Trigger-, Stop-Loss-, Invalidierungs- und Wave-3-Ziele
- Verfolgt historische strukturelle Ergebnisse mit einem 5-Zustands-Markov-Modell
- Berechnet bedingte Wahrscheinlichkeiten für:
-
- Aktivierung von Welle 3
- Invalidierung des Setups
- Frühe Erschöpfung von Welle 3
- Wandelt diese Wahrscheinlichkeiten in einen einzelnen Confidence Score (0–100)
Dies ermöglicht es Tradern, Setups von geringer Qualität herauszufiltern, Überhandel zu vermeiden und Trades nur dann einzugehen, wenn Struktur und Statistik übereinstimmen.
Kernfunktionen
- ✅ Automatische Erkennung von Elliott-Welle 2
- ✅ Mehrere Bestätigungsmodi (Break+Hold, Break, Reclaim, Wick)
- ✅ Klare Trigger-, Stop-Loss-, Invalidierungs- und Zielmarken
- ✅ 5-Zustands-Markov-Wahrscheinlichkeitsmotor (ereignis-/swingbasiert, nicht balkenbasiert)
- ✅ Echtzeit-Bedingungswahrscheinlichkeiten auf dem Chart angezeigt
- ✅ Einzelner Confidence Score (0–100) zur Entscheidungsunterstützung
- ✅ Sauberes, unaufdringliches HUD-Design
- ✅ Funktioniert mit jedem Symbol und jedem Zeitrahmen
Der Confidence Score (wichtig)
Der Confidence Score ist kein Gewinnrate und kein Signal.
Er ist eine kontextbezogene Qualitätsmetrik, die aus historischen strukturellen Übergängen abgeleitet wird:
- Während Welle 2 spiegelt der Score wider:
-
- Die Wahrscheinlichkeit, dass Welle 3 startet
- Angepasst an die Wahrscheinlichkeit eines frühen Scheiterns
- Während Welle 3 spiegelt der Score wider:
-
- Die historische Wahrscheinlichkeit, dass Welle 3 ohne frühe Erschöpfung fortgesetzt wird
In der Praxis:
- Niedrige Werte = Struktur ist schwach oder unzuverlässig
- Hohe Werte = Struktur ist selten, aber statistisch robust
Dies hilft Tradern zu entscheiden, wann sie vorsichtig bleiben und wann sie einen Trade laufen lassen sollten.
Typische Anwendungsfälle
- ✔ Filterung von Elliott-Wellen-Setups vor dem Einstieg
- ✔ Vermeidung von marginalen oder qualitativ schlechten Welle-2-Trades
- ✔ Anpassung der Positionsgröße basierend auf dem Vertrauen
- ✔ Management von Welle-3-Trades mit weniger emotionaler Beeinflussung
- ✔ Unterstützung des diskretionären Tradings mit objektiven Strukturdaten
Der Indikator ist besonders nützlich für Trader, die Elliott-Wellen-Theorie bereits verstehen und quantitative Bestätigung ohne Automatisierung wünschen.
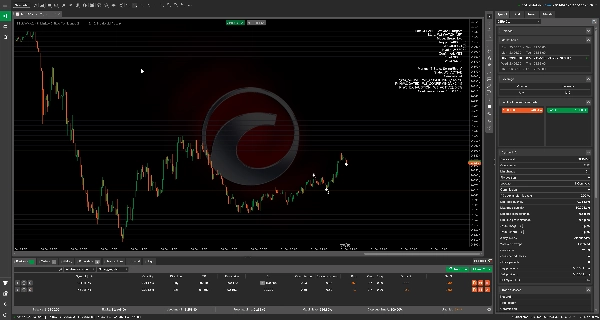
Anwendung (Grundlegender Workflow)
- Hängen Sie den Indikator an ein Chart an
- Wählen Sie Ihren bevorzugten Bestätigungsmodus
- Warten Sie auf eine gültige Welle-2-Struktur
- Beobachten Sie:
-
- Trigger, Stop-Loss, Invalidierung
- Markov-Wahrscheinlichkeiten
- Confidence Score
- Entscheiden Sie, ob das Setup basierend auf Struktur + Vertrauen handelbar ist
Wichtige Hinweise & Haftungsausschluss
- Dieser Indikator ist analytisch, nicht prognostisch
- Er erzeugt keine Kauf-/Verkaufssignale
- Vergangene strukturelle Statistiken garantieren keine zukünftigen Ergebnisse
- Trading beinhaltet Risiken; Nutzer sind vollständig verantwortlich für ihre Entscheidungen
Der Indikator ist als Entscheidungsunterstützungstool für diskretionäre Trader gedacht.
Für wen dieser Indikator gedacht ist
- Trader, die mit Elliott-Wellen-Konzepten vertraut sind
- Diskretionäre Trader, die Struktur über Indikatoren schätzen
- Trader, die objektive Filter suchen, keine automatisierten Systeme
- Nutzer, die Wahrscheinlichkeitskontext und keine Rückblick-Labels wollen
_______________________
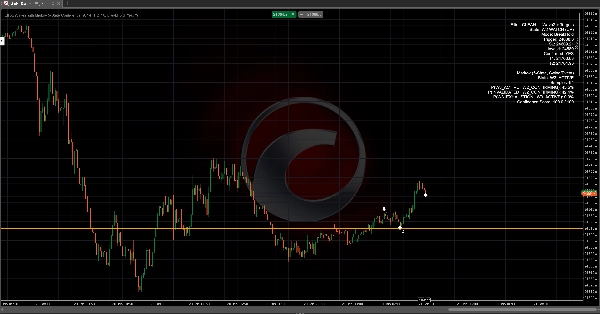
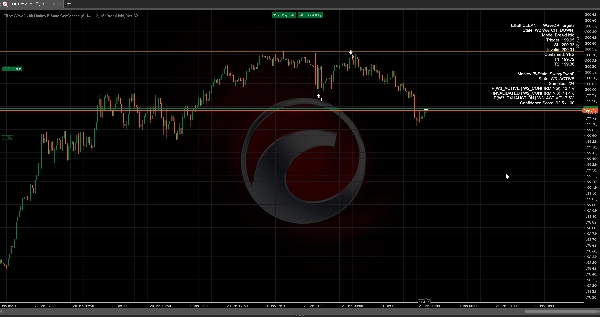
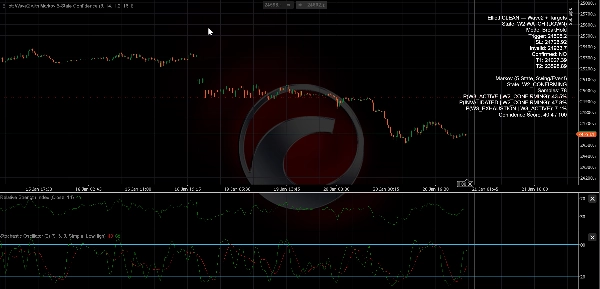
HUD & Zustände
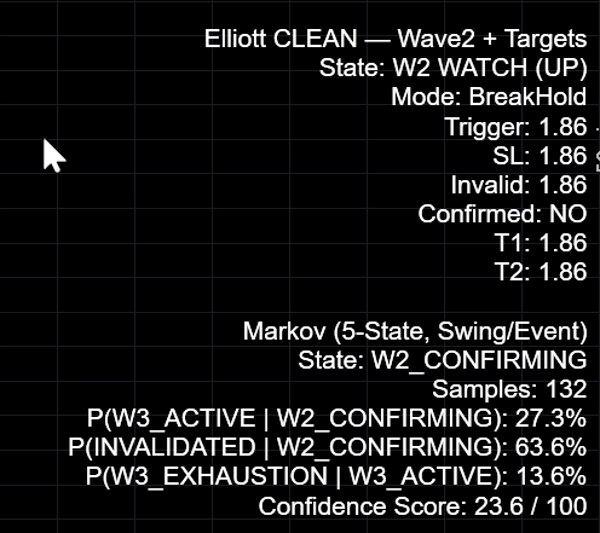
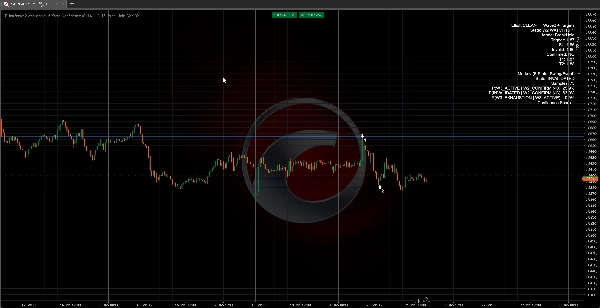
Der Indikator zeigt Struktur-Level und Markov-Wahrscheinlichkeiten direkt im Chart an.
Kern-Elliott-Schicht:
- Zustand: W2 WATCH (AUF/AB) — potenzielle Welle 2 ist vorhanden (Struktur gefunden)
- Bestätigt: JA/NEIN — Ihre ausgewählte Bestätigungsregel wurde ausgelöst
- Trigger — Kurs muss das Level durchbrechen/zurückerobern (abhängig vom Modus)
- SL — vorgeschlagenes Schutz-Stopp-Level (abhängig vom SL-Modus)
- Invalid — strukturelles Invalidierungslevel (Welle-1-Start)
- T1/T2 — Welle-3-Projektionen mit Multiplikatoren
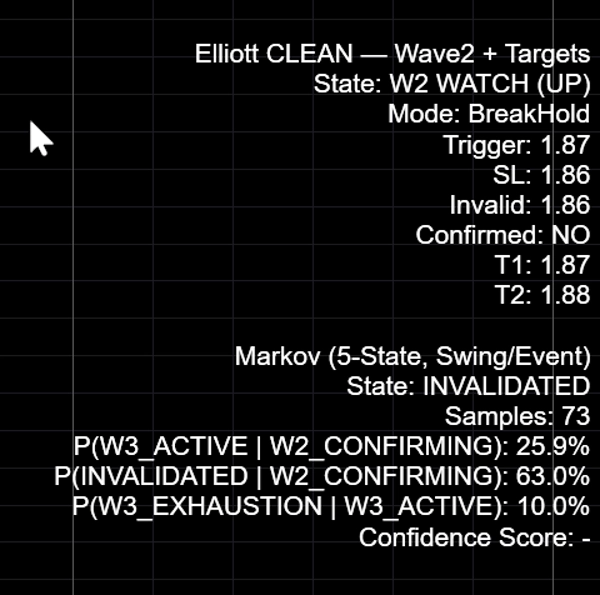
Markov-Schicht:
- Zustand — aktueller Markov-Zustand (z. B.
W2_CONFIRMING,W3_ACTIVE,INVALIDATED) - Samples — historische Anzahl für Wahrscheinlichkeiten
- P(W3_ACTIVE | W2_CONFIRMING) — Chance, dass Welle 3 aus der Welle-2-Phase aktiviert wird
- P(INVALIDATED | W2_CONFIRMING) — Chance, dass das Setup während der Welle-2-Phase scheitert
- P(W3_EXHAUSTION | W3_ACTIVE) — Chance, dass Welle 3 frühzeitig scheitert, sobald sie aktiv ist
Confidence Score (0–100)
Der Confidence Score ist keine Gewinnrate und keine Garantie. Er ist eine Qualitätsmetrik, die aus historischen strukturellen Übergängen abgeleitet wird.
Wie der Score verwendet wird:
- Während
W2_CONFIRMINGspiegelt der Score die „Aktivierungswahrscheinlichkeit“ wider, angepasst an das Risiko eines frühen Scheiterns. - Während
W3_ACTIVEspiegelt der Score die „Fortsetzungsrobustheit“ wider (geringes Risiko früher Erschöpfung).
Interpretieren Sie den Score immer zusammen mit: (1) Strukturklarheit, (2) Invalidierungsabstand und (3) Stichprobengröße.
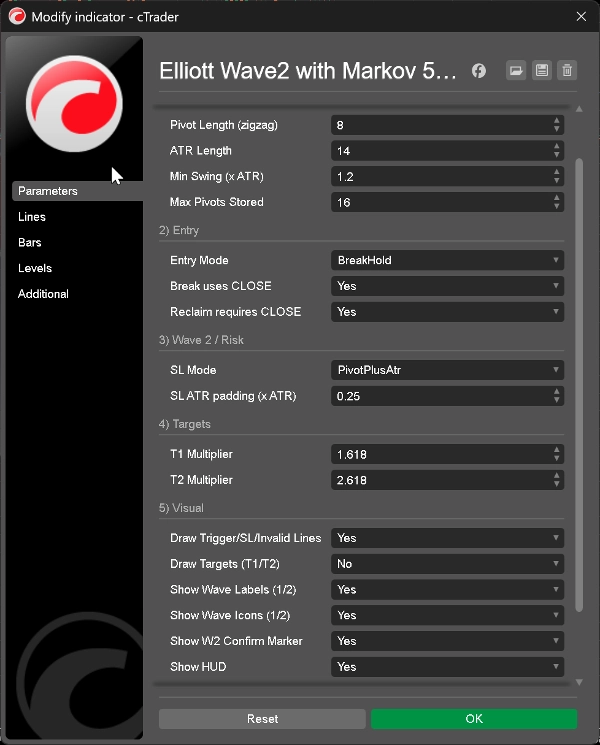
Eingaben (Was sie bewirken)
1) Pivot / Struktur
- Pivot-Länge (Zickzack): Steuert die Swing-Empfindlichkeit. Höher = weniger Swings, sauberere Struktur.
- ATR-Länge: ATR-Fenster zur Swing-Filterung und optionaler SL-Polsterung.
- Min Swing (×ATR): Minimale Swing-Größe zur Akzeptanz eines Pivots (filtert Rauschen).
- Max gespeicherte Pivots: Begrenzt die gespeicherte Swing-Historie (Leistung & Stabilität).
2) Einstieg
- Einstiegsmodus: Wählen Sie den Bestätigungsstil:
-
BreakHold— sicherer: erst durchbrechen, dann über Trigger haltenBreak— schneller: Trigger einmal durchbrechenReclaim— Sweep- und RückeroberungsverhaltenWick— aggressiv: Docht durch Trigger
- Break verwendet CLOSE: Verwendet Schlusskurs statt Docht für Break-Logik (empfohlen).
- Reclaim erfordert CLOSE: Erfordert einen Schlusskurs auf der richtigen Seite nach Sweep.
3) Welle 2 / Risiko
- SL-Modus: Bestimmt die Basislinie für die Stop-Positionierung.
- SL ATR-Polster (×ATR): Zusätzlicher Puffer bei Verwendung eines ATR-basierten Stops.
4) Ziele
- T1-Multiplikator / T2-Multiplikator: Multiplikatoren für Welle-3-Projektionen (Standardwerte: 1.618 und 2.618).
5) Visualisierung
- Trigger/SL/Invalid-Linien zeichnen: Zeigt/versteckt Kern-Horizontale Levels.
- Ziele zeichnen: Optionale Ziellinien (weniger „sauber“).
- Wellenbeschriftungen / Symbole anzeigen: Zeigt Wellenmarker (1/2).
- W2-Bestätigungsmarker anzeigen: Zeigt Bestätigungsmarker.
- HUD anzeigen: Zeigt/versteckt das gesamte HUD.
Anwendung:
- Scannen Sie mehrere Märkte und konzentrieren Sie sich dann nur auf qualitativ hochwertigere strukturelle Umgebungen.
- Verwenden Sie Score + Stichprobengröße, um zu entscheiden, wann ein Setup Zeit und Risiko wert ist.
FAQ
Funktioniert das mit allen Symbolen und Zeitrahmen?
Ja. Es ist ein strukturorientierter Ansatz. Ergebnisse und Wahrscheinlichkeiten variieren je nach Marktverhalten und Volatilität.
Ist der Confidence Score eine Gewinnrate?
Nein. Er ist ein struktureller Qualitätswert, der aus historischen Zustandsübergängen (Markov-Modell) abgeleitet wird. Er garantiert keine Ergebnisse.
Warum ist der Score oft niedrig während Welle 2?
Weil die Aktivierung von Welle 3 selektiv ist. Viele Welle-2-Kandidaten scheitern oder schwanken. Der Indikator ist darauf ausgelegt, diese herauszufiltern.
Was ist mit kleiner Stichprobengröße?
Behandeln Sie Wahrscheinlichkeiten als weniger stabil, wenn die Stichprobengröße klein ist. Verwenden Sie den Score als Kontext, nicht als Sicherheit.
Risikohinweis
Trading beinhaltet Risiken und ist möglicherweise nicht für alle Anleger geeignet. Vergangene Leistungen und historische Wahrscheinlichkeiten garantieren keine zukünftigen Ergebnisse. Dieser Indikator liefert nur analytische Informationen und stellt keine Anlageberatung oder Kauf-/Verkaufsempfehlung dar. Sie sind für Ihre eigenen Entscheidungen, Risikomanagement und die Einhaltung lokaler Vorschriften verantwortlich.
Elliott Wave, Marktstruktur, Technische Analyse, Wahrscheinlichkeit, Statistische Analyse, Swing Trading, Risikomanagement, Entscheidungsunterstützung
Zusammenfassung
Kundenbewertungen
5 | 100 % | |
4 | 0 % | |
3 | 0 % | |
2 | 0 % | |
1 | 0 % |


