
FinTracker
Indikator
14 downloads
Version 1.0, May 2026
Windows, Mac
5.0
Bewertungen: 1
Seit 21/02/2025
466.3M
Gehandeltes Volumen
180.83K
Pip-Gewinn
22
Verkäufe
6.87K
Kostenlose Installationen
Beschreibung
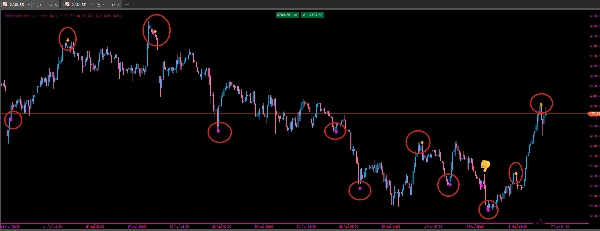
Dieser Indikator kombiniert die Kernlogik des Traders Dynamic Index (TDI) mit fortschrittlicher Mustererkennung für "Shark Fin"- und "Extreme Cross"-Signale. Er verfolgt die Marktvolatilität durch benutzerdefinierte Bollinger-ähnliche Bänder, die auf den RSI angewendet werden, und identifiziert Wendepunkte mit hoher Wahrscheinlichkeit, wenn die RSI-Linie diese Volatilitätszonen durchbricht und dann wieder betritt.
Hauptmerkmale
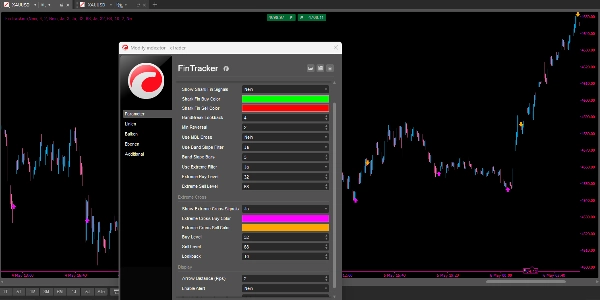
- TDI Kernlogik: Verwendet einen 10-Perioden-RSI mit dynamischen Volatilitätsbändern zur Visualisierung von Marktstimmung und Stärke.
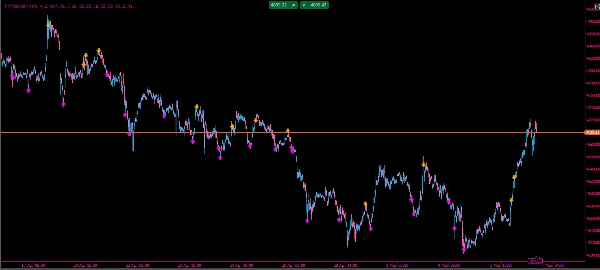
- Shark Fin-Erkennung: Erkennt schnelle "Spitzen", bei denen der RSI aus den Bändern ausbricht und sich schnell umkehrt, was auf einen möglichen Erschöpfungspunkt hinweist.
- Extreme Cross-Signale: Markiert Kreuzungen, die bei überkauften oder überverkauften Niveaus auftreten (z. B. über 68 oder unter 32).
- Mehrschichtige Filterung: Beinhaltet optionale Filter für Bandneigung und "Market Base Line" (MBL)-Kreuzungen zur Rauschreduzierung.
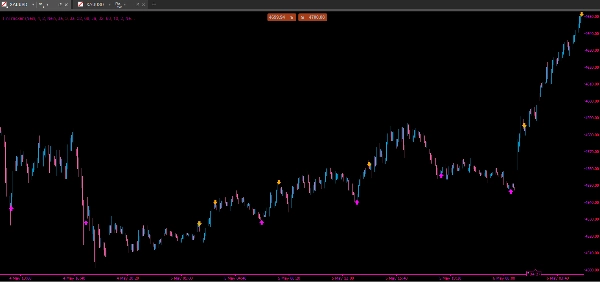
- Echtzeit-Benachrichtigungen: Integrierte visuelle Pfeile im Chart, Konsolenprotokollierung und optionale Pop-up-Benachrichtigungen für den Live-Handel.
Um die Gewinnrate des FinTracker Indikators zu maximieren, wird dringend empfohlen, Signale im Kontext der Marktstruktur zu betrachten, anstatt sie isoliert zu handeln. Hier sind die professionellen Empfehlungen für eine effektive Umsetzung:
Strategische Empfehlungen
- HTF (High Time Frame) Übereinstimmung: Stimmen Sie Ihre Trades immer mit dem dominanten Trend ab. Wenn das H4-Chart bullisch ist, priorisieren Sie Shark Fin Kauf-Signale auf den M15- oder H1-Charts. Das Handeln gegen den HTF-Trend erhöht das Risiko, ausgestoppt zu werden, erheblich.
- MBL (Market Base Line) Filterung: Verwenden Sie die gelbe MBL (die Mittellinie) als "Momentum-Tor". Ein Shark Fin Kauf ist viel stärker, wenn der RSI anschließend über die MBL kreuzt und bestätigt, dass das bullische Momentum tatsächlich zurückgekehrt ist.
- Volatilitätsbewusstsein: Shark Fins sind am zuverlässigsten, wenn die Volatilitätsbänder erweitert sind. In einer "Squeeze" (engen Bändern) ist der Markt oft seitwärts gerichtet, was zu falschen Ausbrüchen führt. Warten Sie auf ein klares "Durchstoßen" eines breiten Bandes für die besten Ergebnisse.
- Divergenzvalidierung: Suchen Sie nach "Hidden Divergence" für Trendfortsetzungen oder "Regular Divergence" für Umkehrungen. Wenn der Preis ein tieferes Tief bildet, der FinTracker jedoch einen höheren Shark Fin Kauf bildet, ist die Wahrscheinlichkeit einer Umkehr außergewöhnlich hoch.
- Risikomanagement: Platzieren Sie Ihren Stop Loss leicht außerhalb des jüngsten Preis-Schwunghochs oder -tiefs, das durch den Shark Fin "Spike" entstanden ist. Streben Sie ein Mindest-Risiko-Ertrags-Verhältnis von 1:2 an und trailen Sie Ihren Stop, sobald der RSI die MBL kreuzt.
Zusammenfassung
Indikatorprofil
Indikatorkategorie
Unterstützung und Widerstand
Ausgabetyp
Signale
Datenanforderungen
Nur Balken
Unterstützte Signale
Abweichung
Wendepunkt
Kundenbewertungen
5.0
Bewertungen: 1
5 | 100 % | |
4 | 0 % | |
3 | 0 % | |
2 | 0 % | |
1 | 0 % |
Kundenbewertungen
May 27, 2026
One of the best indicator I've used so far I've tried dozens of indicators over the years and this one stands out. It keeps things simple without losing accuracy. Works great across multiple assets — forex, crypto, and indices.
Diskussion
Häufig gestellte Fragen (FAQ)
Key Levels
RSI
Liquidity Grab
Über den cTrader Store verfügbare Produkte, einschließlich Handelsbots, Indikatoren und Plugins, werden von externen Entwicklern bereitgestellt und nur zu Informations- und technischen Zugriffszwecken verfügbar gemacht. cTrader Store ist kein Broker und erbringt keine Anlageberatung, persönlichen Empfehlungen oder eine Garantie für zukünftige Performance.


Preis
Seit 21/02/2025
466.3M
Gehandeltes Volumen
180.83K
Pip-Gewinn
22
Verkäufe
6.87K
Kostenlose Installationen