present
Inscrivez-vous et bénéficiez d'une remise de 50 $ sur votre premier achat
Trading product for Sync Lines Indicateur Key Levels Support & Resistance, image 1
Sync Lines
Indicateur
Version 1.0, May 2026
Windows, Mac
Trading product for Sync Lines Indicateur Key Levels Support & Resistance, image 2
Trading product for Sync Lines Indicateur Key Levels Support & Resistance, image 3
Depuis le 06/04/2026

Description

Professional Multi-Chart Level Synchronization Tool for cTrader

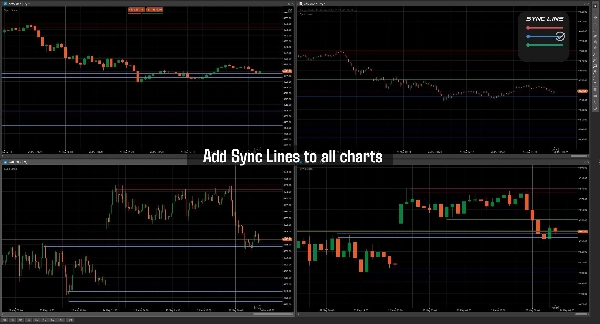
Sync Horizontal Lines is a professional charting utility built for traders who rely heavily on support/resistance zones, liquidity areas, market structure, and multi-timeframe analysis inside cTrader. The indicator allows traders to draw horizontal price levels once and automatically synchronize them across all charts of the same symbol instantly.

Unlike traditional manual chart marking, Sync Horizontal Lines removes repetitive work by keeping levels aligned between different timeframes and chart layouts. Whether you are analyzing M1, M15, H1, or Daily charts, your important levels remain fully synchronized and visually consistent.

The indicator includes a fast hotkey-based workflow for creating, deleting, and color-cycling lines directly from the chart without opening settings panels or menus. Traders can organize support, resistance, liquidity zones, entries, stop losses, take profits, session highs/lows, or custom execution levels using multiple line colors.

A built-in persistent storage system automatically saves all lines locally, ensuring that your levels remain available even after restarting cTrader. Each symbol maintains its own independent synchronized levels, preventing chart clutter between instruments.

Designed for speed and efficiency, Sync Horizontal Lines is lightweight, responsive, and suitable for scalpers, day traders, swing traders, ICT traders, SMC traders, prop firm traders, and multi-monitor trading setups.

Main Features

  • Real-time synchronized horizontal levels across charts
  • Same-symbol multi-timeframe synchronization
  • Automatic local save/load persistence
  • Fast keyboard + mouse workflow
  • Multiple line color management
  • Lightweight and low resource usage
  • Instant level updating across charts
  • No manual re-drawing required
  • Professional workflow optimization


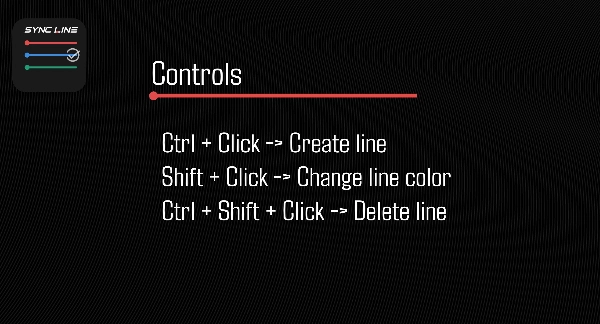
Controls

  • Ctrl + Click → Create line
  • Shift + Click → Change line color
  • Ctrl + Shift + Click → Delete line


Ideal For

  • Support & Resistance traders
  • ICT and SMC strategies
  • Scalping workflows
  • Intraday trading
  • Liquidity mapping
  • Session range marking
  • Multi-monitor setups
  • Professional chart management


Installation

Simply add the indicator to your Multicharts of different timeframe and start drawing using the keyboard shortcuts. No setup required.

The Indicator must be added to different charts to work properly.

Résumé

Profil de l'indicateur
Catégorie de l'indicateur
Assistance et résistance
Type de résultat
Visualisation
Exigences en matière de données
Barres seulement

Discussion

Avis clients

0.0
Avis : 0
Avis clients
Il n'y a pas encore d'avis sur ce produit. Vous l'avez déjà essayé ? Soyez le premier à en parler aux autres !

Questions fréquentes

Key Levels
Support & Resistance
Les produits disponibles sur cTrader Store, notamment les bots de trading, les indicateurs et les plug-ins, sont fournis par des développeurs tiers et mis à disposition à titre informatif et à des fins d'accès technique uniquement. cTrader Store n'est pas un courtier et ne fournit aucun conseil en investissement, aucune recommandation personnelle ni aucune garantie quant aux performances futures.

Vous pourriez aussi aimer

Indicateur
AI
Prop
+7
EMA Clouds, Multi-Timeframe (MTF) Overlay, Swing High/Low detection, and a smart Dashboard with neutral zone filtering.
Indicateur
RSI
Signal
+1
Multi-timeframe version of the Quantitative Qualitative Estimation (QQE) indicator.
Indicateur
Prop
Forex
+4
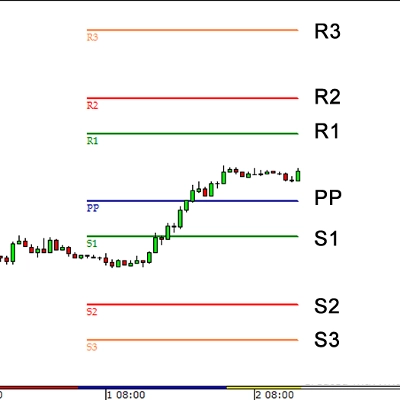
Pivot Points Standard — All-in-One Multi-Timeframe Pivot Indicator for cTrader
Indicateur
AI
SMC
+4
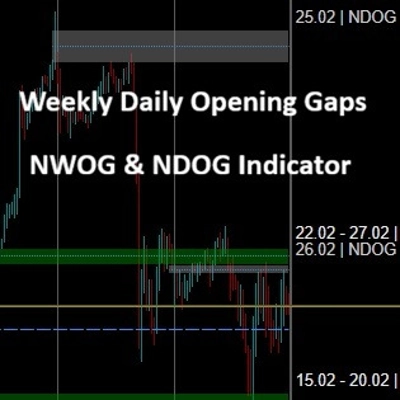
Weekly Daily Opening Gaps — NWOG & NDOG Indicator Professional-grade opening gap visualization for institutional traders
Indicateur
ATR
Prop
+5
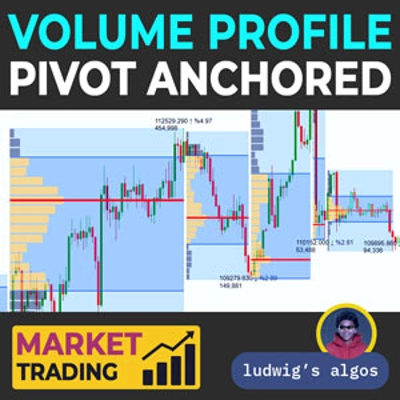
Anchor volume profiles to pivots with POC, VAH, VAL and real-time insights for clearer trade decisions.
Indicateur
ATR
RSI
+5
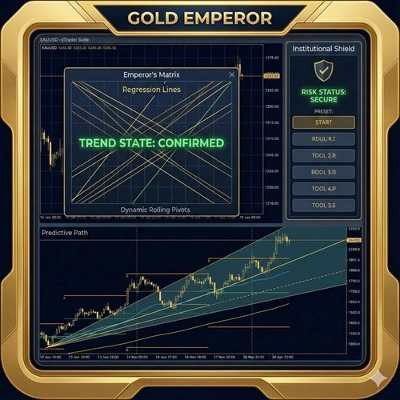
Gold Emperor: AI-driven XAUUSD dominance. Dynamic pivots, matrix trend logic, and institutional shield protection.
Logo de "ORB v1.1"
Populaire
4.0
(4)
$25
Indicateur
Breakout
Opening Range Breakout v1.1 - Visuals + Stats
Indicateur
BOS
EMA
+5
Market structure signals graded A to C, each with a drawn trade plan, plus an adaptive trend ribbon and a trend matrix
Indicateur
SMC
Prop
+14
Right-anchored cTrader Volume Profile with VAH/VAL/POC, LVZ, top volume+EMA, themes, and fast, readable visuals.
Indicateur
Prop
Forex
+9
Average Cost Price helps you keep track of your open positions on the chart. In doing so, it provides lines and explanat
Indicateur
AI
ATR
+27
VolumeProfileSuite is an advanced and flexible Volume Profile indicator for cTrader.
Indicateur
BOS
VWAP
+4
Gold premiun XAUUSD Exclusive Real-Time Adaptive Intelligence
Indicateur
ATR
BOS
+5
Market structure with BOS and CHoCH, order blocks, and retest buy/sell arrows with entry, stop and two targets
Indicateur
Prop
Forex
+5
Traders Panel: Scan 15 pairs across 5 timeframes. Live heatmap, strength rankings and best setups in one panel.
Indicateur
ATR
RSI
+4
RSI bands drawn on price, confluence-scored BUY/SELL signals, an ATR stop with three targets
Indicateur
AI
ATR
+26
The Triple Momentum indicator for cTrader is a versatile trend-following tool.
Indicateur
Risk Dashboard
AI-powered daily range forecasts help traders spot volatility opportunities and plan stops and targets.
Indicateur
Volume
Order Block
+3
Map market structure, order blocks, liquidity and key zones with an interactive cTrader dashboard.

Prix

Depuis le 06/04/2026