OR Session Zones
Indikator
Version 1.1, Dec 2025
Windows, Mac
4.5
Bewertungen: 2
Beschreibung
OR-Sitzungszonen — Multi-Session Opening Range Indikator
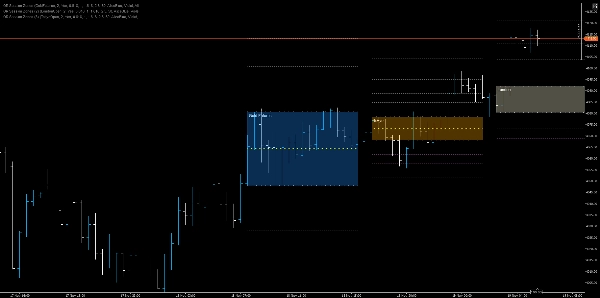
Ein hochpräziser Opening Range Indikator, der Sitzungseröffnungen (NY, London, EU, Tokio, Shanghai, Gold-/Rohöl-Futures) erkennt, dynamische OR-Hoch/Tief/Mittel-Zonen zeichnet, Fibonacci-basierte Ziele projiziert und einen konfigurierbaren schattierten Bereich für schnelle visuelle Entscheidungen darstellt.
Hauptmerkmale
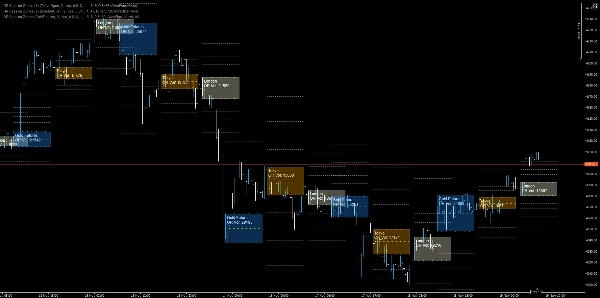
- Multi-Session-Erkennung: Native Unterstützung für New York, London, EuroNext, Tokio, Shanghai, Gold-Futures und Rohöl-Futures Eröffnungsbalken mit dedizierten Sitzungsindikatoren.
- Opening Range Berechnung: Berechnet OR Hoch und OR Tief aus einer konfigurierbaren Anzahl von Kerzen (RangeCandles) und zeichnet die Sitzungsstartzeit auf.
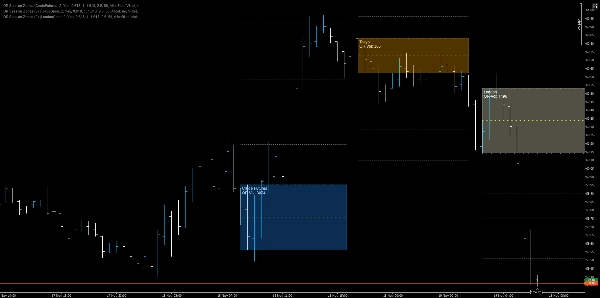
- Persistente Chart-Overlays: Zeichnet Trendlinien für OR Hoch, OR Tief und OR Mittel (50%) über das gesamte Chart bis zu einer konfigurierbaren Verlängerungszeit.
- Schattierte Zone: Gefülltes Rechteck zwischen OR Hoch und OR Tief mit konfigurierbarer Deckkraft und Farbe pro Sitzung für sofortigen visuellen Kontext.
- Fibonacci-Projektionen: Bis zu vier R (Widerstands-) und S (Unterstützungs-) Projektionslinien, abgeleitet vom OR-Bereich mit unabhängigen Farben und einstellbarer Deckkraft.
- Flexible Sichtbarkeit: Option zum Ausblenden oder Rendern indizierter (einzigartiger) Objekt-IDs zur Vermeidung von Kollisionen; unterstützt sowohl einzelne persistente Objekte als auch pro-Balken-Objekte, wenn Hide aktiviert ist.
- Sitzungsfarbcodierung: Jede Sitzung verwendet ein eigenes Farbschema (z.B. DodgerBlue, LightYellow, Orange, OrangeRed), um die Sitzungsherkunft sofort erkennbar zu machen.
Wie es Händlern hilft
- Schneller Kontext: Sofort sehen, wo der Markt für eine wichtige Sitzung eröffnet hat, und die frühe Range-Struktur ohne manuelle Messung verstehen.
- Entscheidungsauslöser: Verwenden Sie OR-Durchbrüche, Mittellinien-Abweisungen und Fibonacci-Projektionen als Ein-/Ausstiegsregeln oder Stop-Placement-Anker.
- Multi-Session-Strategie: Kombinieren Sie überlappende ORs (z.B. London + NY), um Sitzungs-Konfluenzzonen und Handelsbereiche mit höherer Wahrscheinlichkeit zu erkennen.
- Risikomanagement: Platzieren Sie Stops hinter OR-Stapeln oder verwenden Sie die Mitte (50%) als dynamische Stop-/Take-Ziele.
Anwendungsszenarien und Beispielregeln
- Breakout-Einstieg: Kaufen beim Schlusskurs über OR Hoch mit Bestätigung durch Volumen oder Momentum; Stop knapp unter OR Hoch (oder OR Mitte für engere Ausstiege).
- Fade die Eröffnung: Short nahe OR Hoch mit Umkehrbestätigung, wenn der Preis es nicht schafft, über OR Mitte zu bleiben und ein schnelles Zurückziehen der Gebote zeigt.
- Sitzungs-Konfluenz-Handel: Wenn London- und NY-ORs sich überlappen, behandeln Sie die Überlappung als eine Zone mit hoher Zuverlässigkeit für Angebot/Nachfrage und passen Sie die Positionsgröße entsprechend an.
- Projektion-Ziele: Verwenden Sie R1/R2/R3/R4 als gestaffelte Take-Profit-Level und S1 - S4 symmetrisch für Abwärtsziele.
Zusammenfassung
Indikatorprofil
Kundenbewertungen
4.5
Bewertungen: 2
5 | 50 % | |
4 | 50 % | |
3 | 0 % | |
2 | 0 % | |
1 | 0 % |
Kundenbewertungen
November 22, 2025
Solid enough as a backup opinion, and It can look better than it is during a lucky run.
November 19, 2025
Diskussion
Häufig gestellte Fragen (FAQ)
Fibonacci
Forex
Breakout
Indices
EURUSD
Commodities
GBPUSD
XAUUSD
NAS100
Über den cTrader Store verfügbare Produkte, einschließlich Handelsbots, Indikatoren und Plugins, werden von externen Entwicklern bereitgestellt und nur zu Informations- und technischen Zugriffszwecken verfügbar gemacht. cTrader Store ist kein Broker und erbringt keine Anlageberatung, persönlichen Empfehlungen oder eine Garantie für zukünftige Performance.


![„[Hamster-Coder] Bollinger Bands“-Logo](https://cdn.ctrader.com/image/webp/21d8e5d6-fb11-4bac-b9ee-cd05c2b76804_30327)


Preis
26
Verkäufe
2.15K
Kostenlose Installationen