
Beschreibung
Berechnen Sie den gleitenden Durchschnitt für jeden Marktzeitpunkt und verfolgen Sie das Preisverhalten, während er sich nach vorne erstreckt.
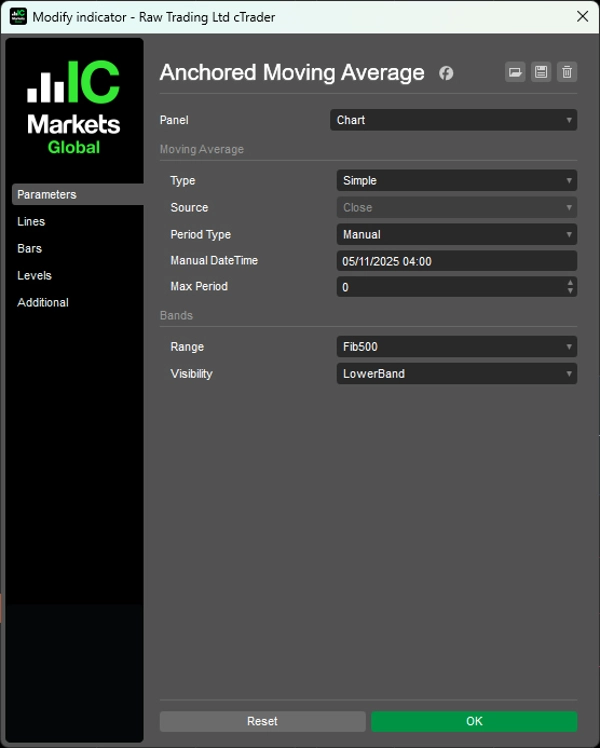
Verankert die Berechnung an Ihrem gewählten Startpunkt (manuelles Datum/Uhrzeit oder Rückblickzeitraum von 1 Stunde bis 10 Jahre) und wächst dann natürlich mit adaptiven Fibonacci-Bändern basierend auf der tatsächlichen Preisspanne.
Acht Fibonacci-Niveaus (11,4 % bis 100 %), die sich an die reale Preisbewegung anpassen, integrierte 38,2 %-62,8 % Mean-Reversion-Zone, zwei MA-Typen (SMA/EMA), mehrere Anzeigemodi (vollständige Bänder, nur extreme Grenzen, nur Reversionszone) und eine Maximalperiodenbegrenzung für lange Zeitrahmen bieten ereignisbasierte Momentumverfolgung für Trader, die Rücksetzer von bedeutenden Schwungpunkten und die Analyse des Preisverhaltens nach Ereignissen anstreben.
FUNKTIONEN
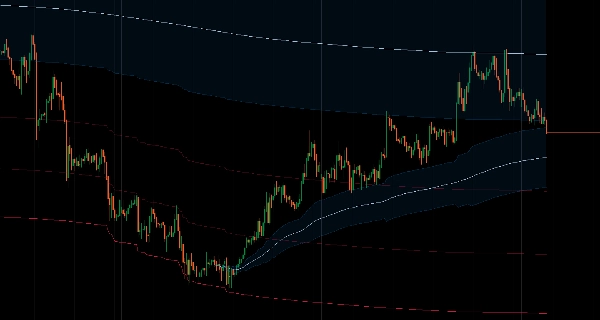
Zeitverankerte Berechnung
- Im Gegensatz zu Standard-MAs mit festen Perioden wächst dieser natürlich von Ihrem gewählten Startpunkt
- Flexible Verankerung: Manuelles Datum/Uhrzeit einstellen oder vordefinierte Rückblickzeiträume verwenden (1 Stunde bis 10 Jahre)
- Verfolgen Sie das Momentum von bedeutenden Marktzeitpunkten
- Konsistente Ankerpunkte über verschiedene Zeitrahmen hinweg
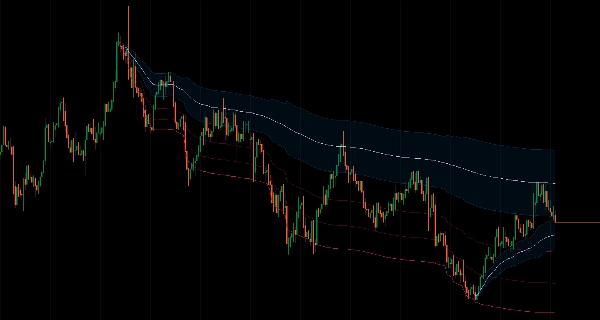
Adaptive Fibonacci-Bänder
- Automatisch berechnete Bänder basierend auf der tatsächlichen Preisspanne, nicht auf willkürlichen ATR-Vielfachen
- 8 Fibonacci-Niveaus (11,4 % bis 100 %), die sich an die reale Preisbewegung anpassen
- Mean-Reversion-Zonen: Eingebaute 38,2 %-62,8 % Reversionszone für Einstiegsbereiche mit hoher Wahrscheinlichkeit
- Mathematisch definierte Wahrscheinlichkeitszonen
Zwei MA-Typen
- Einfacher gleitender Durchschnitt
- Exponentieller gleitender Durchschnitt
- Maximale Periodenbegrenzung: Verhindert Überglättung bei langen Zeitrahmen
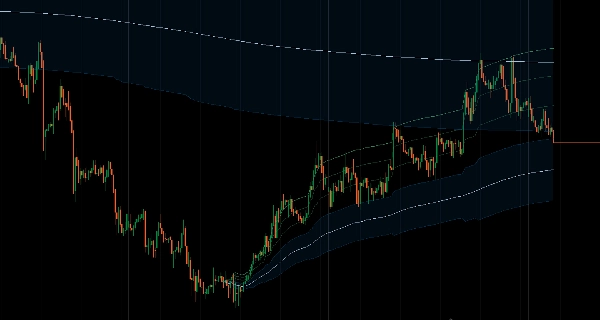
Mehrere Anzeigemodi
- Volle Bänder: Alle Fibonacci-Niveaus sichtbar
- Nur obere/untere Grenzen: Zeigt extreme Grenzen
- Nur Reversionszone: Fokus auf Mean-Reversion-Bereich
- Sauberes, zielgerichtetes Design ohne Unordnung
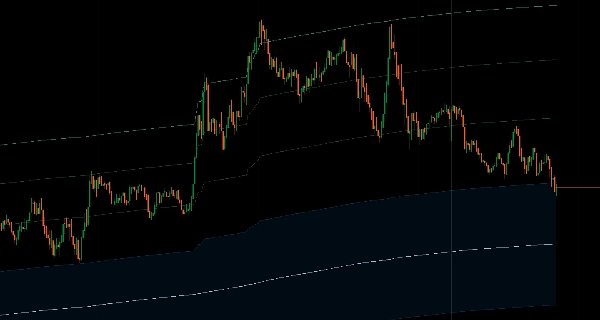
Ereignisbasierte Analyse
- Sehen Sie, wie der aktuelle Preis zur Bewegung von bedeutenden Niveaus in Beziehung steht
- Verfolgen Sie das Preisverhalten nach Ereignissen
- Strukturierte Einstiege mit klaren Bezugspunkten
__________________________________________________________________________________________
MEHR KOSTENLOSE INDIKATOREN
Entdecken Sie eine breite Palette von Marktanalysetools – von Struktur und Volumen bis hin zu Regression, Volatilität und benutzerdefinierten Zeitrahmen.
Der Quellcode ist im GitHub Repository verfügbar.
Alle kostenlos nutzbar. Aber wenn Sie Lust haben, eine Kaffee-Unterstützung zu senden, können Sie sie hierhinleiten.
Unterstützung/Widerstand
Volumen
- Volumen-Aktivitätsprofiler
- Volumen-Effizienz-Analysator
- Volumenprofil-Analytik
- Volumenprofil - Aktualisiert
- Volumenstreuungsanalyse
- VWAP (Volumen-gewichteter Durchschnittspreis)
Gleitende Durchschnitte
- SSL-Kanal
- Verankerter gleitender Durchschnitt
- Abweichungsskaliertes gleitendes Mittel
- Gann High Low Aktivator
- Instantane Trendlinie
- Kaufman Adaptive MA mit Trend Vision
- Gleitender Durchschnittskanal
- Gleitende Durchschnitte Suite
- Trendkanal gleitender Durchschnitt
Dienstprogramme/Benutzerdefiniert
Regressionsbasiert
Volatilität
Oszillatoren
__________________________________________________________________________________________
HAFTUNGSAUSSCHLUSS
Der Handel birgt Risiken. Dieser Indikator ist nur für die technische Analyse gedacht – wenden Sie stets ein angemessenes Risikomanagement an und handeln Sie verantwortungsbewusst.
FEEDBACK & VERBESSERUNGEN
Wenn Sie Vorschläge, Funktionswünsche oder Ideen zur Verbesserung haben, hinterlassen Sie bitte einen Kommentar im Diskussions-Tab. Ihr Feedback hilft, den Indikator für alle zu verbessern.
Zusammenfassung
The indicator features adaptive Fibonacci bands calculated based on the actual price range, not arbitrary multiples. It includes eight Fibonacci levels from 11.4% to 100%, with a built-in mean reversion zone between 38.2% and 62.8%, providing mathematically defined probability zones for potential entry areas. Multiple display modes are available, including full bands, extreme boundaries only, or reversion zone only, designed for a clean and purposeful chart presentation.
This tool facilitates analysis of price behavior relative to significant swing points or events, supporting structured entries and post-event price tracking. It is intended for technical analysis and includes a disclaimer advising responsible trading with proper risk management.
Kundenbewertungen
5 | 100 % | |
4 | 0 % | |
3 | 0 % | |
2 | 0 % | |
1 | 0 % |


