
Beschreibung
🚀 Über 10.000 Trader nutzen bereits unsere TOP-Indikatoren🏆
Entdecken Sie, warum Profis uns wählen – die leistungsstärksten Tools auf cTrader (Indikatoren, Algorithmen und cBots) warten auf Sie.
👉 Holen Sie sich hier alle unsere TOP-Systeme:
_______________________________________________
_______________________________________________
📌 Marktstruktur-Indikatoren
· ✅ AdvancedMarket Structure: Bos, Choch, SwinLevels, Order Blocks, Marktstruktur& Liquiditätsfinder
· 🔄 Dynamische Marktstrukturanalyse von Wendepunkten
· 🧱 Order Block
· ⚖️ Marktungleichgewicht
· ⛓️ BOS & CHOCH
· 🧠 ICT Power of 3
______________________________________________________________-
Store cBots : 🧠 Gold & BTC BreakoutSession Pivots 🧠
_______________________________________________
🔚 Intelligente Ausstiegssysteme
· 📍 Trailing Smart Algorithmus
_______________________________________________
📐 ZigZag-Indikatoren
· 🔍 ZigZag Preis-Liquiditätsprojektion
· ➖ ZigZag
· 🎯 Zig-Zag Extremitäts-Tracker
_______________________________________________
🧱 Support- & Resistance-Indikatoren
· 🟩 SmartTrend Support- & Resistance-Linien
· 🧱 Alle Support- und Resistance-Level
_______________________________________________
📊 Trend- & Kanalindikatoren
· 🔄 Auto-Trend-Kanal
· 📊 Supertrend
· 🔁 Reaktive gleitende Durchschnittslinie
_______________________________________________
💧 Volumen- & Liquiditäts-Tools
_______________________________________________
⚡ Momentum- & RSI-Indikatoren
· 🚀 Dynamisches Range-Momentum
· 🔎 Multi-Level Candle Bias Tracker
_______________________________________________
🔮 Prognose- & Projektions-Tools
· 📐 Prognose basierend auf Linreg & ATR
· 📏 Fibonacci Lineare Regression Multi-Timeframe
· 📈 Volumengetriebener Marktfluss-Projektor
_________________________________________________________________________________
_________________________________________________________________________________
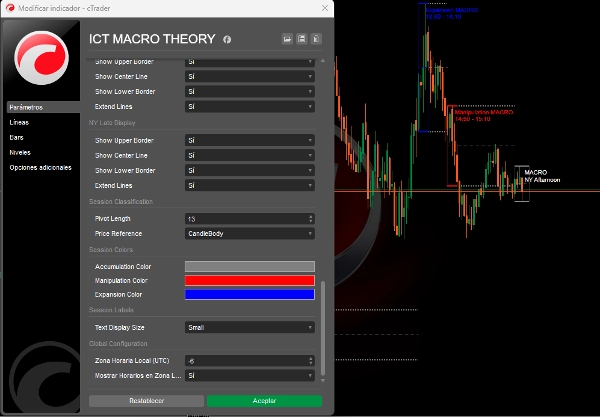
🌐 ICT MACRO THEORIE
⚠️ WICHTIGER HINWEIS: Dieser Indikator funktioniert nur auf Zeitrahmen unter 5 Minuten.
Erklärung der ICT-Makroperioden
ICT-Makroperioden sind im Wesentlichen kurze Intervalle, in denen der Algorithmus nach Liquidität sucht oder den Preis für Fair Value Gaps anpasst. Die Grundlage dieser ICT-Makros liegt in ICTs Zeit- und Preistheorie.
Ein Makro ist "eine kurze Folge von Anweisungen, die ein Ereignis in der Preisgestaltung erzeugt", wie von ICT selbst definiert.
ICT-Makros sind keine vollständigen Handelsstrategien, können jedoch Konfluenz zu Ihren Trades hinzufügen und Gewinne maximieren. Sie treten während der London-, New York-, Mittags- und Nachmittagssitzungen auf.
🔮 Fortgeschrittene Implementierung der ICT-Makrozeiten-Theorie:
Direkte Verbindung zu ICT-Konzepten:
Der Code implementiert genau die 3 Arten von ICT-Makros, die in der Theorie beschrieben sind, unter Verwendung einer Klassifikationslogik basierend auf:
- Marktstrukturanalyse:
-
- Erkennung von Makrositzungen
- Erfasst genaue ICT-Zeiten (London 02:33, NY 09:50, etc.).
- Erkennt strukturelle Veränderungen vor und während jeder Makrositzung.
- Automatische Klassifizierung in:
-
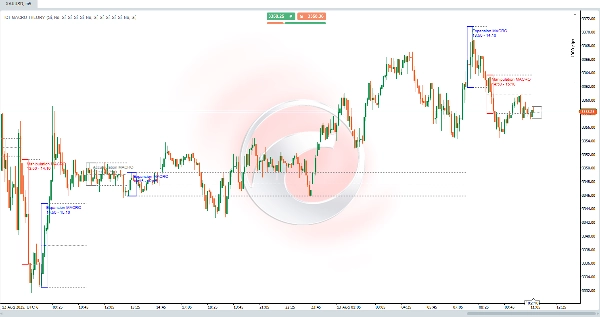
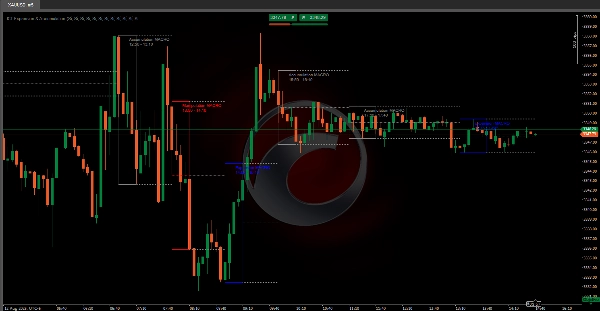
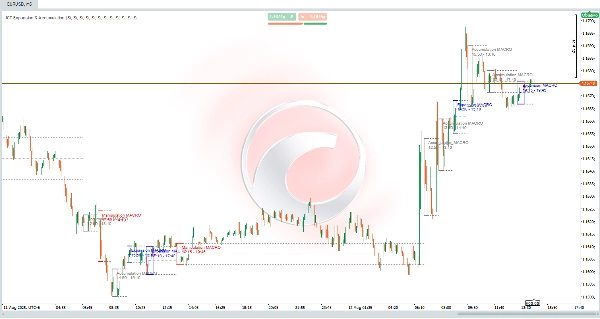
- 🟥 Manipulation: Wenn der Preis Liquidität auf beiden Seiten (Kauf/Verkauf) abräumt.
- 🟦 Expansion: Richtungsbewegungen, die Liquidität auf einer Seite aufnehmen (im Einklang mit dem Trend).
- 🟩 Akkumulation: Enger Bereich, in dem der Preis Liquidität "ansammelt".
- Erweiterte Schlüsselbereiche:
-
- Zeichnet Hochs/Tiefs jeder Makrositzung.
- Berechnet und verlängert den Durchschnittspreis (Mittelpunkt) bis zur nächsten Sitzung.
- Diese Levels fungieren als dynamische Unterstützung/Widerstand (Wesentlich in ICT!).
- Echtzeit-Liquiditätserkennung:
-
- Verwendet 1-Minuten-Daten, um genaue Wendepunkte zu identifizieren (wie auf niedrigeren Zeitrahmen zu sehen).
Kommende Verbesserungen & Updates:
- Erkennung von Liquiditätsräumungen: Wird vorherige Liquiditätsräumungen (Hochs/Tiefs des Vortags/Woche) identifizieren.
- Fair Value Gaps (FVG): Wird Fair Value Gaps erkennen und visualisieren.
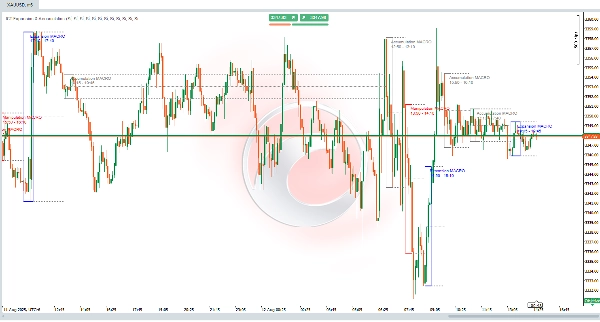
📊 Praktisches ICT-Beispiel
NY-Eröffnungsszenario (09:50-10:10):
- Vor der Sitzung: Der Preis räumt Kaufseiten-Liquidität (lokales Tief) ab.
- Während der Sitzung:
-
- Klassifiziert als 🟥 MANIPULATION.
- Preis wechselt zu bärischer Struktur.
- Nach der Sitzung:
-
- Verlängerte Linien markieren Widerstand bei Sitzungs-Hochs.
- Handelsablehnung in der Zone mit RR 1:3.
✅ Treue zum ICT-Prinzip:
"Makros sind keine vollständigen Strategien, fügen aber Konfluenz hinzu, indem sie identifizieren, wo Algorithmen nach Liquidität suchen."
Zusammenfassung
The indicator analyzes market structure and detects key macro sessions—London, New York, midday, and afternoon—recording exact ICT times. It classifies price behavior into three types of macros: Manipulation (price sweeps liquidity on both sides), Expansion (directional movement aligned with trend), and Accumulation (tight range where price accumulates liquidity). It also draws and extends session highs, lows, and average price levels to act as dynamic support and resistance.
Using 1-minute data, ICT MACRO THEORY detects precise pivots for real-time liquidity identification. While not a complete trading strategy, it adds confluence to trades by highlighting where algorithms seek liquidity. Planned updates include detection of liquidity sweeps and visualization of fair value gaps.
This tool is intended for traders seeking to incorporate ICT macro time concepts into their analysis for enhanced market structure insight and liquidity detection on very short timeframes.


