Beschreibung
Intrinsischer Rekursiver Wertindikator
Überblick
Der Intrinsische Rekursive Wert ist ein benutzerdefinierter Indikator, der rekursive Relative-Stärke-Berechnungen über mehrere Perioden nutzt, um intrinsische Markttrends zu identifizieren. Er bestimmt wichtige Preisniveaus, bei denen die Trendstärke ein kritisches Niveau erreicht, und bietet Einblicke in potenzielle Umkehrungen und Trendbestätigungen. Das Konzept des Intrinsischen Rekursiven Werts basiert auf der Idee, dass Marktimpulse und Trendstärken durch die Anwendung mehrerer Schichten der Kursanalyse rekursiv verfeinert werden können. Dieser rekursive Ansatz hilft, tief verwurzelte bullische und bärische Bedingungen zu erkennen, die traditionelle kursbasierte Indikatoren möglicherweise übersehen.
Bullische & Bärische Handelszonen
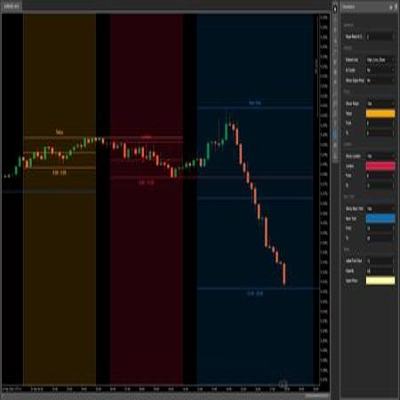
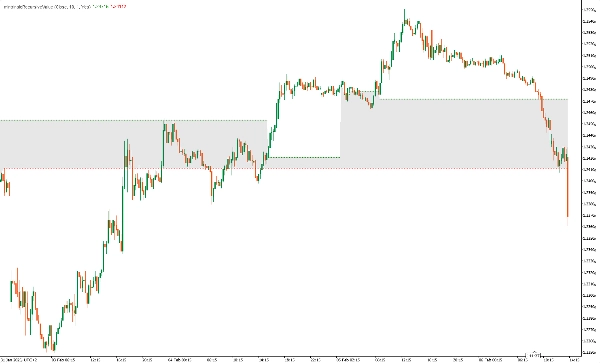
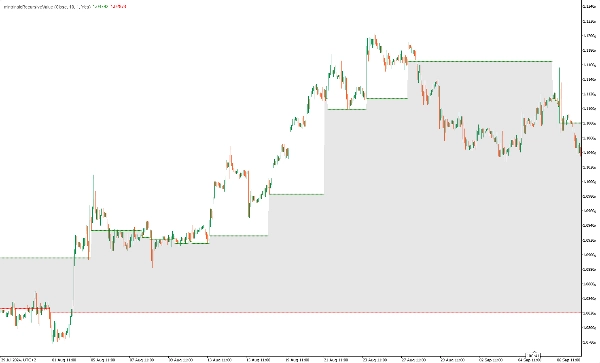
- Bullische Handelszone: Diese Zone entsteht, wenn der intrinsische rekursive Wert anhaltende bullische Stärke bestätigt. Sie tritt auf, wenn alle rekursiven Relative-Stärke-Berechnungen Werte über dem Gleichgewicht anzeigen, was auf einen starken Aufwärtsimpuls hindeutet. Die bullische Handelszone hilft Händlern, potenzielle Long-Einstiegspunkte und dynamische Unterstützungsbereiche zu identifizieren, in denen der Preis weiter steigen könnte.
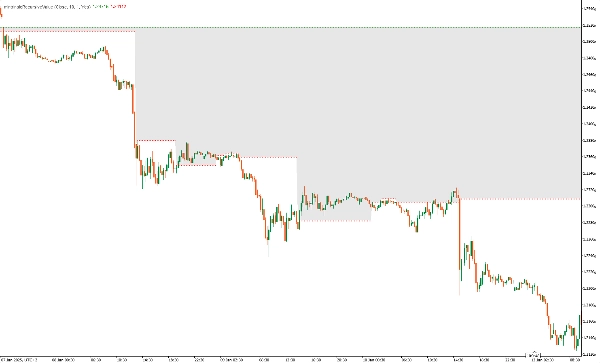
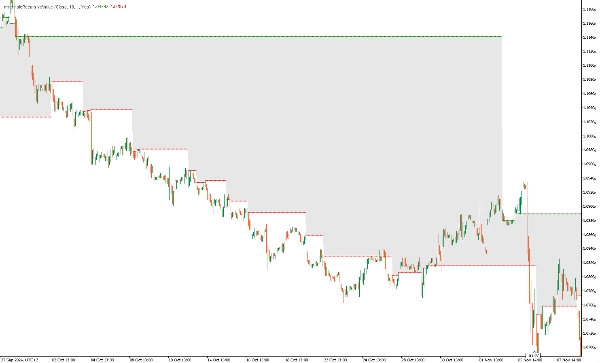
- Bärische Handelszone: Diese Zone wird gebildet, wenn der intrinsische rekursive Wert kontinuierliche bärische Stärke erkennt. Wenn alle rekursiven Relative-Stärke-Werte unter dem Gleichgewicht liegen, signalisiert dies einen anhaltenden Abwärtstrend und bietet Händlern Möglichkeiten für Short-Einstiege sowie die Definition dynamischer Widerstandsniveaus, an denen der Preis weiter fallen könnte.
Indikator-Ausgaben
- outIntrinsicRecursiveLong : Zeigt das intrinsische Long-Niveau an, wenn bullische Stärke erkannt wird.
- outIntrinsicRecursiveShort: Zeigt das intrinsische Short-Niveau an, wenn bärische Stärke erkannt wird.
Anwendung
- Trendbestätigung: Hilft bei der Identifizierung starker bullischer oder bärischer Trends, wenn alle Relative-Stärke-Perioden übereinstimmen.
- Umkehrerkennung: Signalisiert potenzielle Wendepunkte, wenn sich der intrinsische Wert ändert.
- Unterstützungs- & Widerstandsniveaus: Die intrinsischen Werte fungieren als dynamische Unterstützungs- und Widerstandsniveaus.
Beispiel-Handelsstrategie
- Long-Einstieg: Gehen Sie eine Long-Position ein, wenn das intrinsische Long-Niveau erreicht ist und die Kursbewegung bullischen Schwung bestätigt, das bedeutet, der Preis liegt über dem Gleichgewichtswert (grüne Komponente des Indikators).
- Short-Einstieg: Gehen Sie eine Short-Position ein, wenn das intrinsische Short-Niveau erreicht ist und die Kursbewegung bärischen Schwung bestätigt, das bedeutet, der Preis liegt unter dem Gleichgewichtswert (rote Komponente des Indikators).
- Ausstiegsstrategie: Verwenden Sie Trailing Stops oder das Verschwinden der intrinsischen Niveaus, um Positionen zu schließen.
Hinweise
- Der Indikator ist für Trendfolgestrategien konzipiert und funktioniert am besten in trendstarken Märkten.
- Er kann mit anderen Indikatoren wie Momentum-Indikatoren zur Bestätigung von Handelssignalen kombiniert werden.
Fazit
Der Intrinsische Rekursive Wertindikator ist ein leistungsstarkes Werkzeug für Händler, die ihre Trendanalyse mithilfe rekursiver Relative-Stärke-Berechnungen verbessern möchten. Durch die Identifizierung wichtiger Preisniveaus mit hoher Wahrscheinlichkeits-Trends liefert dieser Indikator wertvolle Einblicke in die Marktrichtung und potenzielle Handelsmöglichkeiten.