
Beschreibung
ERWEITERTE VERSION VERFÜGBAR — HIER
Sie sehen derzeit die Originalversion. Die erweiterte Version dieses Indikators wurde mit zusätzlichen Funktionen veröffentlicht:
- Verbesserte Altersanzeige: Jahre, Monate, Wochen, Tage Format (z.B. „3j 2w 4d“)
- Alle FVGs anzeigen: Setzen Sie „FVG zur Anzeige“ auf -1, um unbegrenzte historische FVGs anzuzeigen
- Gefüllte FVGs verlängern: Option zum Verlängern gefüllter FVG-Boxen bis zur aktuellen Kerze
- Fibonacci-Niveaus: Automatische Niveaus (23,6 %, 38,2 %, 50 %, 61,8 %, 78,6 %) auf teilweisen und gefüllten FVGs
- Schwellenwert für Teilfüllung: Anpassbarer Schwellenwert (50-99 %, Standard 90 %)
__________________________________________________________________________________________
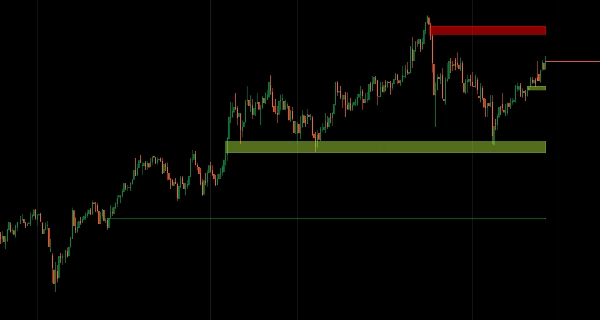
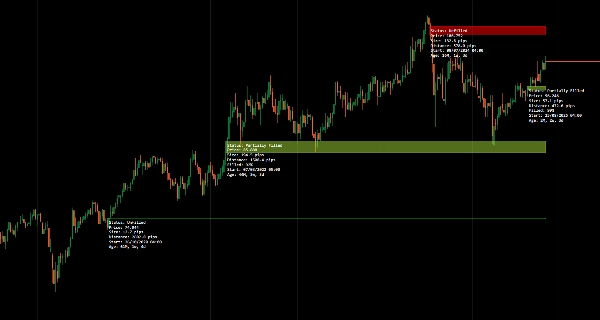
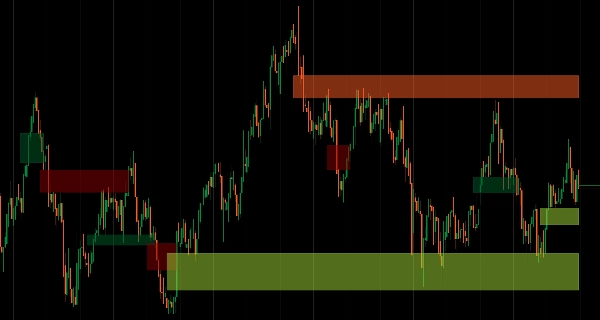
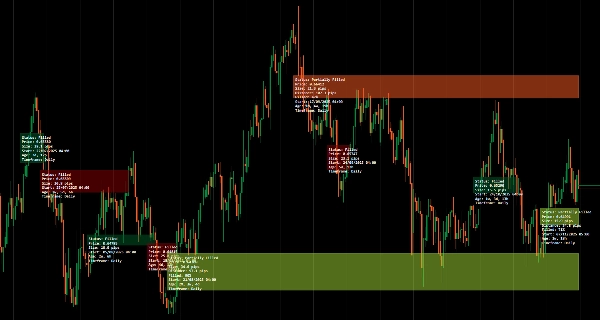
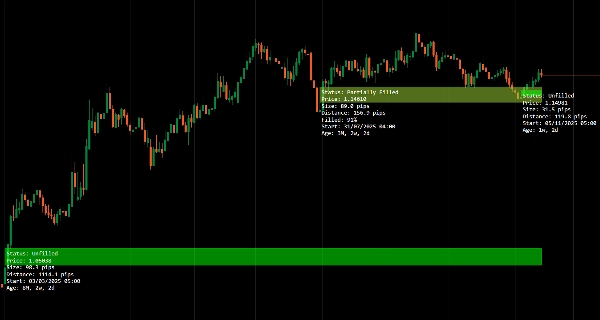
Identifizieren Sie Fair Value Gaps mit Altersverfolgung und Überwachung des Füllstatus.
Erkennt automatisch bullische und bärische Gaps, verfolgt deren Füllverhalten (ungefüllt, teilweise, vollständig gefüllt) in Echtzeit und zeigt das Gap-Alter zur Priorisierung an.
Multi-Timeframe-Scan zur Ausrichtung von HTF-Struktur-Gaps mit LTF-Preisbewegungen, dynamische Statusaktualisierungen bei Interaktion des Preises mit Zonen und minimale, unaufdringliche Beschriftungen liefern eine fokussierte Analyse von Liquiditätsungleichgewichten für Trader, die Gap-Füllungen und strukturbasierte Einstiege anstreben.
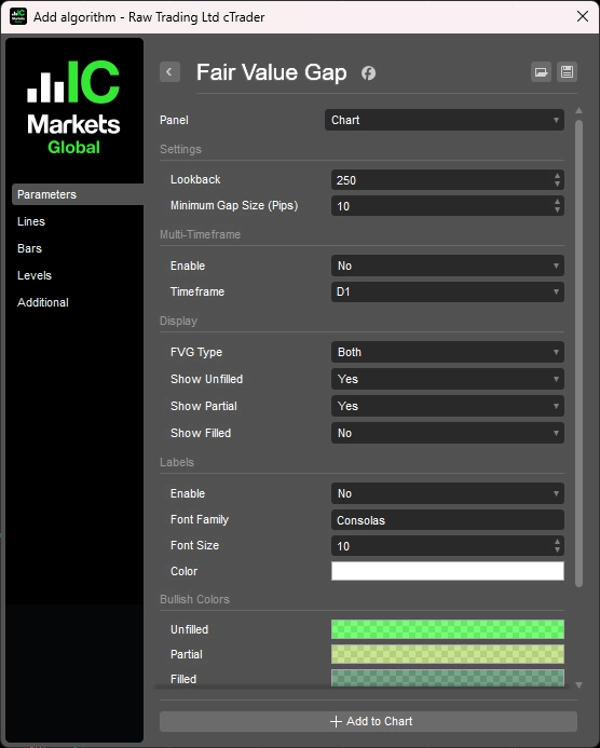
FUNKTIONEN
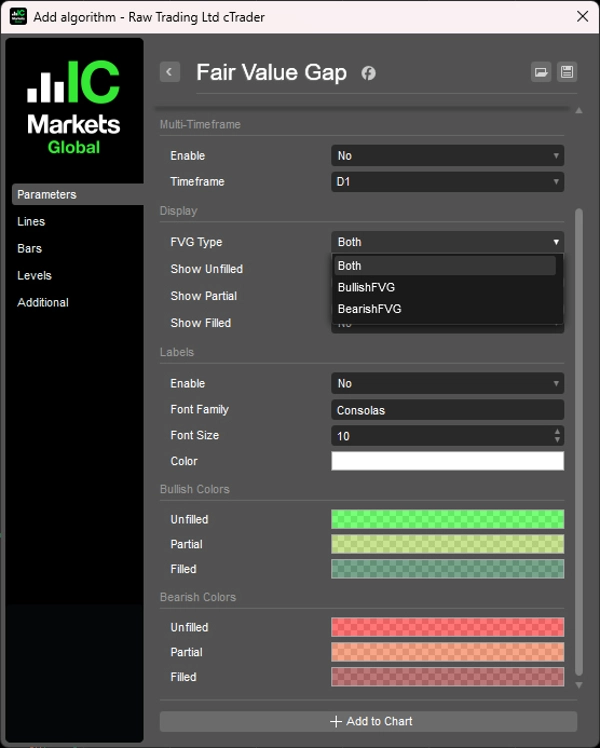
FVG-Erkennung
- Erkennt automatisch bullische und bärische Fair Value Gaps
- Verfolgt den Status ungefüllt, teilweise gefüllt und vollständig gefüllt in Echtzeit
- Saubere visuelle Darstellung mit minimaler Chart-Unordnung
Altersbeschriftung
- Zeigt an, wie viel Zeit seit der Bildung jedes Gaps vergangen ist
- Hilft bei der Priorisierung von frischen gegenüber alten Gaps für die Handelsauswahl
- Zeitlicher Kontext verbessert die Entscheidungsfindung zur Relevanz des Gaps
Statusverfolgung
- Zeigt aktuellen Füllstatus: ungefüllt, teilweise gefüllt oder vollständig gefüllt
- Aktualisiert sich dynamisch, wenn der Preis mit dem Gap interagiert
- Visuelle Bestätigung der Liquiditätserfassung
Multi-Timeframe-Modus
- Scannt und zeigt FVGs höherer Zeitrahmen auf Charts niedrigerer Zeitrahmen an
- Richtet HTF-Struktur-Gaps mit LTF-Preisbewegungen aus
- Verbessert den Analyse-Workflow über mehrere Zeitrahmen
Saubere, minimale Benutzeroberfläche
- Unaufdringliche Beschriftungen, die auf Klarheit ausgelegt sind
- Informativ, ohne Ihre Preisansicht zu überladen
- Professionelle Präsentation für fokussierte Analyse
__________________________________________________________________________________________
MEHR KOSTENLOSE INDIKATOREN
Entdecken Sie eine breite Palette von Marktanalysetools – von Struktur und Volumen bis hin zu Regression, Volatilität und benutzerdefinierten Zeitrahmen.
Der Quellcode ist im GitHub Repository verfügbar.
Alle kostenlos nutzbar. Aber wenn Sie Lust haben, eine Kaffee-Unterstützung zu senden, können Sie diese hierhinleiten.
Support/Widerstand
Volumen
- Volume Activity Profiler
- Volume Efficiency Analyzer
- Volume Profile Analytics
- Volume Profile - Aktualisiert
- Volume Spread Analysis
- VWAP (Volumen-gewichteter Durchschnittspreis)
Gleitende Durchschnitte
- Verankerter gleitender Durchschnitt
- Abweichungsskaliertes gleitendes Mittel
- Instantane Trendlinie
- Kaufman Adaptive MA mit Trend Vision
- Gleitender Durchschnittskanal
- Gleitende Durchschnitte Suite
- Trendkanal gleitender Durchschnitt
Dienstprogramme/Benutzerdefiniert
Regressionsbasiert
Volatilität
Oszillatoren
__________________________________________________________________________________________
HAFTUNGSAUSSCHLUSS
Der Handel ist mit Risiken verbunden. Dieser Indikator ist nur für die technische Analyse gedacht – wenden Sie stets ein angemessenes Risikomanagement an und handeln Sie verantwortungsbewusst.
FEEDBACK & VERBESSERUNGEN
Wenn Sie Vorschläge, Funktionswünsche oder Ideen zur Verbesserung haben, hinterlassen Sie bitte einen Kommentar im Diskussions-Tab. Ihr Feedback hilft, den Indikator für alle zu verbessern.
Zusammenfassung
Kundenbewertungen
5 | 100 % | |
4 | 0 % | |
3 | 0 % | |
2 | 0 % | |
1 | 0 % |


