
3 Bar Triangle by Linda Raschke
Indikator
534 downloads
Version 1.0, Sep 2024
Windows, Mac
5.0
Bewertungen: 1
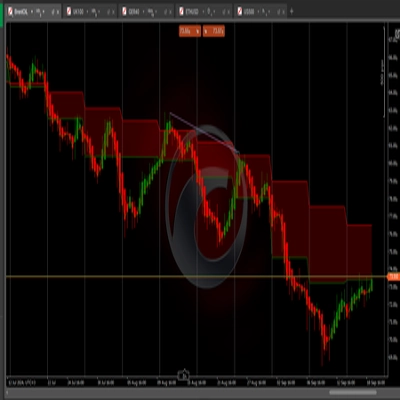
Dieses Muster deutet auf Konsolidierung oder Preisdruck hin, bei dem sich der Preis innerhalb eines engeren Bereichs zusammenzieht. Der Markt "spannt sich an" für einen möglichen Ausbruch in beide Richtungen, was typischerweise zu einer starken Bewegung führt, sobald er aus dem Dreieck ausbricht.
Handel des Ausbruchs:
- Einstieg: Händler suchen nach einem Ausbruch über das Hoch des Musters oder unter das Tief des Musters, was die Richtung der nächsten Bewegung anzeigt.
- Stop-Loss: Das Platzieren eines Stop-Loss außerhalb der gegenüberliegenden Seite des Dreiecks (entweder über dem Hoch oder unter dem Tief) hilft, das Risiko zu steuern.
- Ziele: Einige Händler zielen auf eine Kursbewegung ab, die der Größe des Dreiecks entspricht (der Abstand zwischen dem Hoch und Tief der ersten Kerze)
Indikatorprofil
5.0
Bewertungen: 1
5 | 100 % | |
4 | 0 % | |
3 | 0 % | |
2 | 0 % | |
1 | 0 % |
Kundenbewertungen
August 12, 2025
Pros: Identifies classic 3-bar triangle consolidation zones. Simple setup, visually clear. Stable across timeframes. Cons: No alerts or tooltips. Lacks volume filters and signal confirmation. Limited customization
Breakout
Über den cTrader Store verfügbare Produkte, einschließlich Handelsbots, Indikatoren und Plugins, werden von externen Entwicklern bereitgestellt und nur zu Informations- und technischen Zugriffszwecken verfügbar gemacht. cTrader Store ist kein Broker und erbringt keine Anlageberatung, persönlichen Empfehlungen oder eine Garantie für zukünftige Performance.
Mehr von diesem Autor


Seit 19/09/2024
314.61K
Gehandeltes Volumen
258.47K
Pip-Gewinn
534
Kostenlose Installationen