MAMA CANDLES
지표
버전 1.0, Sep 2024
Windows, Mac
4.5
리뷰: 2
설명
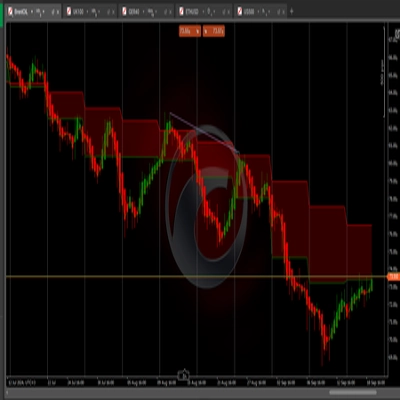
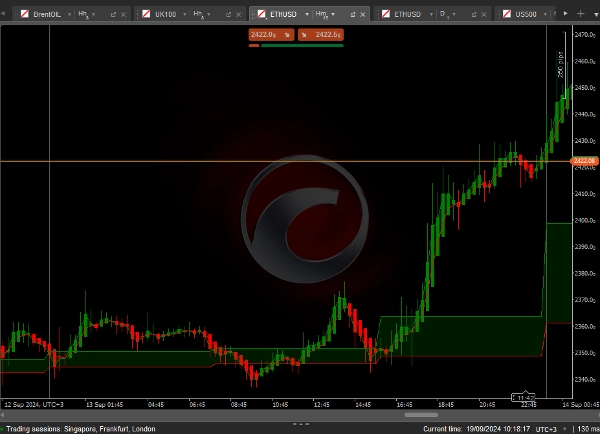
이 코드는 MESA 적응 이동 평균(MAMA) 지표를 구현하며, 이는 주기성에 반응하고 가격 데이터를 부드럽게 처리하도록 설계된 복잡한 적응 필터입니다. 주요 특징은 다음과 같습니다:
주요 요소:
- 힐버트 변환: 이 지표는 힐버트 변환을 사용하여 가격 시리즈의 지배 주기 위상과 주기를 계산하며, 이는 시장 주기를 식별하는 데 도움을 줍니다.
- 적응형 MAMA & FAMA:
-
- MAMA는 지배 주기에 적응하는 더 빠른 이동 평균입니다.
- FAMA는 더 부드럽고 느린 평균입니다.
- 두 지표 모두 서로 다른 색상으로 차트에 표시됩니다.
- 맞춤형 캔들스틱 색상:
-
- MAMA가 FAMA 위에 있을 때(강세 조건) 캔들스틱은 녹색으로 색칠됩니다.
- MAMA가 FAMA 아래에 있을 때(약세 조건) 캔들스틱은 빨간색으로 색칠됩니다.
요약
지표 프로필
고객 리뷰
4.5
리뷰: 2
5 | 50 % | |
4 | 50 % | |
3 | 0 % | |
2 | 0 % | |
1 | 0 % |
상담
자주 묻는 질문(FAQ)
트레이딩 봇, 지표, 플러그인 등 cTrader Store에서 제공되는 상품은 제3자 개발자에 의해 제공되며, 이는 단순히 정보 및 기술적 접근을 목적으로 제공된 것입니다. cTrader Store는 중개인이 아니며, 투자 조언, 개인별 추천 또는 향후 성과에 대한 어떠한 보장도 제공하지 않습니다.
이 작성자의 상품 더 보기


좋아하실 만한 다른 항목


!["[Hamster-Coder] Pivot Points MTF" 로고](https://cdn.ctrader.com/image/webp/4c143e5a-309c-40e3-a578-f04d1e133ffa_31159)


!["Gaussian Channel [Iridio Capital]" 로고](https://cdn.ctrader.com/image/webp/7c039209-5573-4a54-a072-f9528b503103_41960)


가격
가입일 19/09/2024
314.61K
거래량
258.47K
핍 수익
536
무료 설치