present
سجل واحصل على خصم 50 دولارًا على مشترياتك الأولى
Trading product for Rigid Volume Profile مؤشر Key Levels Volume, image 1
Rigid Volume Profile
مؤشر
الإصدار 1.0، Sep 2026
Windows, Mac
Trading product for Rigid Volume Profile مؤشر Key Levels Volume, image 2
Trading product for Rigid Volume Profile مؤشر Key Levels Volume, image 3
Trading product for Rigid Volume Profile مؤشر Key Levels Volume, image 4
Trading product for Rigid Volume Profile مؤشر Key Levels Volume, image 5
Trading product for Rigid Volume Profile مؤشر Key Levels Volume, image 6
Trading product for Rigid Volume Profile مؤشر Key Levels Volume, image 7
Trading product for Rigid Volume Profile مؤشر Key Levels Volume, image 8
Trading product for Rigid Volume Profile مؤشر Key Levels Volume, image 9
Trading product for Rigid Volume Profile مؤشر Key Levels Volume, image 10
Trading product for Rigid Volume Profile مؤشر Key Levels Volume, image 11
15
المبيعات
299
التثبيتات المجانية

الوصف

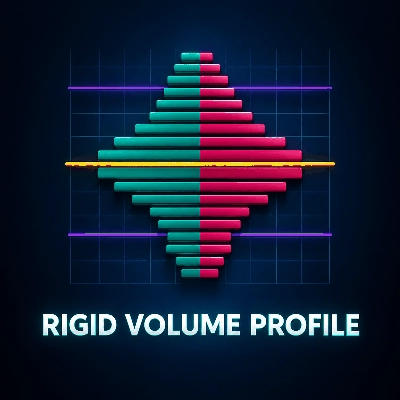
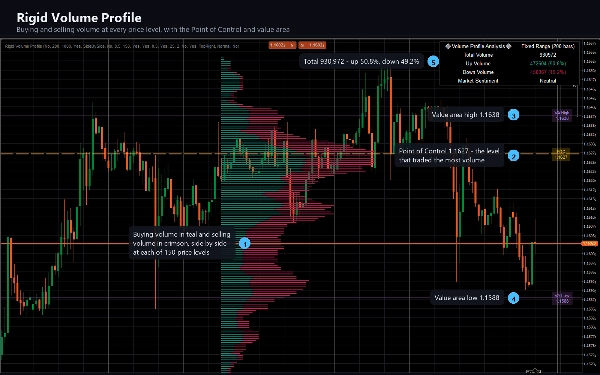
يقسم ملف الحجم الصلب نافذة النظر إلى عدد ثابت من مستويات الأسعار ويُظهر مقدار الحجم المتداول عند كل مستوى، مقسماً إلى ضغط الشراء والبيع.


ما يرسمه


مخطط أفقي بجانب حركة السعر، مبني من آخر N أشرطة. يتم تقسيم شريط كل مستوى إلى حجم صعودي (من الأشرطة التي أغلقت مرتفعة) وحجم هبوطي (من الأشرطة التي أغلقت منخفضة)، بحيث يمكنك رؤية ليس فقط مكان حدوث التداول ولكن أي جانب كان يقوم به. الأشرطة التي أغلقت دون تغيير تقسم حجمها بالتساوي بين الجانبين.


خط نقطة السيطرة المنقط يحدد مستوى السعر الذي تم تداول أكبر حجم عنده في النافذة، مع تسمية بسعره الدقيق.


خطان لمنطقة القيمة يحددان المستويات التي تمثل 70% من حجم النافذة، مع تسمية كل منهما.


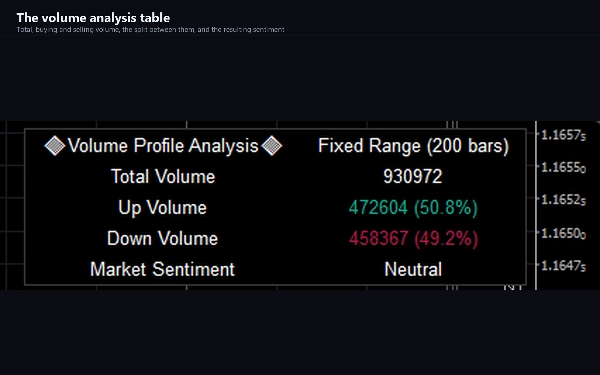
جدول تحليل الحجم يعرض الحجم الكلي، الصاعد والهابط مع النسب المئوية، وقراءة معنوية بناءً على الجانب المسيطر.


كيفية استخدامه


تصف ملفات الحجم مكان حدوث التداول فعلياً، بدلاً من المكان الذي تحرك فيه السعر فقط. المستوى الذي استوعب الكثير من الحجم هو مستوى يهتم به العديد من المشاركين؛ الجزء الرقيق من الملف هو نطاق سعري تحرك السوق خلاله بسرعة.


اقرأ نقطة السيطرة كمركز ثقل النافذة. اقرأ منطقة القيمة كنطاق حيث تم إنجاز معظم الأعمال. اقرأ الفجوة الرقيقة بين عقدتين ثقيلتين كمنطقة يميل السعر إلى عبورها بدلاً من التوقف فيها. راقب أي جانب من الانقسام يهيمن على مستوى عندما يعود السعر إليه.


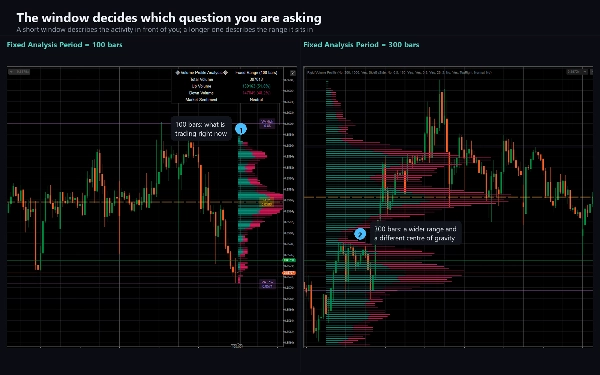
النافذة من اختيارك وتتغير الصورة معها، لذا اختر فترة نظر تتناسب مع القرار الذي تتخذه. ملف 100 شريط يجيب عن سؤال مختلف عن ملف 500 شريط.


الإعدادات الرئيسية


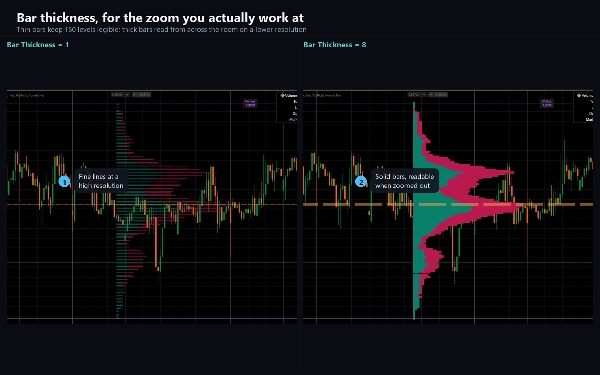
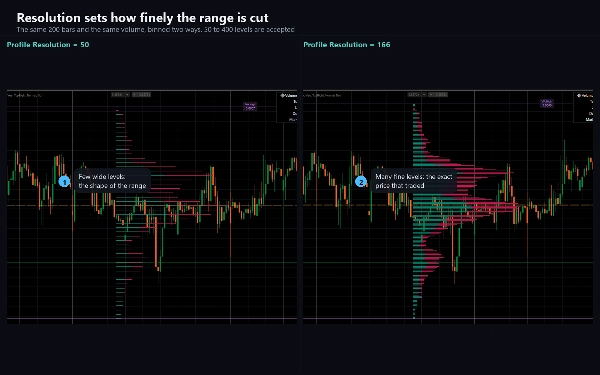
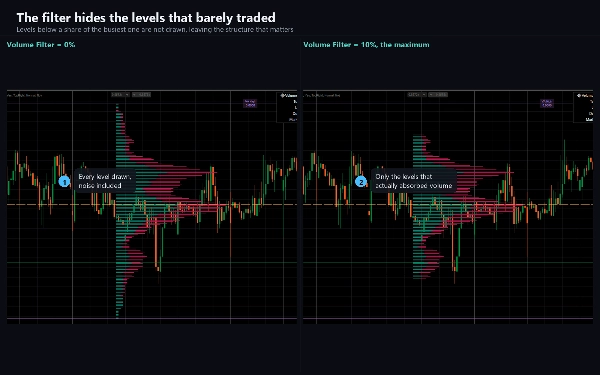
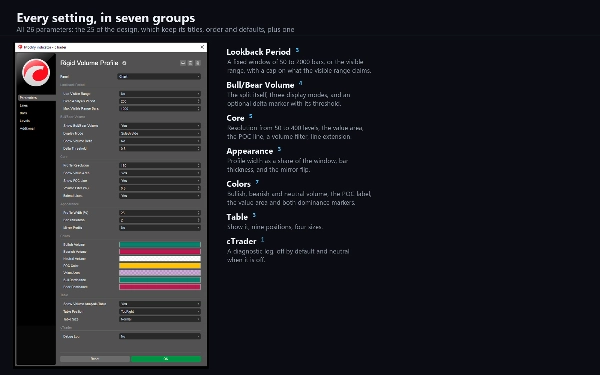
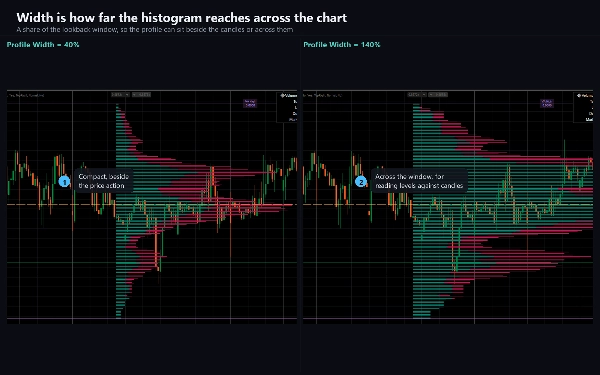
فترة التحليل الثابتة تحدد فترة النظر بالأشرطة، من 50 إلى 2000. دقة الملف تحدد عدد مستويات السعر التي يُقسم إليها النطاق، من 50 إلى 400؛ المستويات الأقل تقرأ كملف كلاسيكي، والمزيد تعطي تفاصيل دقيقة. وضع العرض يقدم جنباً إلى جنب، مكدس ومنقسم. عرض الملف يضبط حجم المخطط كنسبة مئوية من فترة النظر. فلتر الحجم يخفي المستويات التي تقل عن نسبة مئوية من الأكثر ازدحاماً. عرض دلتا الحجم يضيف علامة حيث يهيمن جانب بوضوح. كل لون قابل للتعديل، ويمكن نقل جدول التحليل إلى أي من تسع مواقع أو إيقافه.


استخدام النطاق المرئي يبدل فترة النظر إلى الأشرطة الموجودة حالياً على الشاشة بدلاً من عدد ثابت.


نوع المؤشر والنافذة


تراكب على الرسم البياني. يرسم على مخطط السعر نفسه، وليس في لوحة منفصلة.


الأطر الزمنية والأدوات


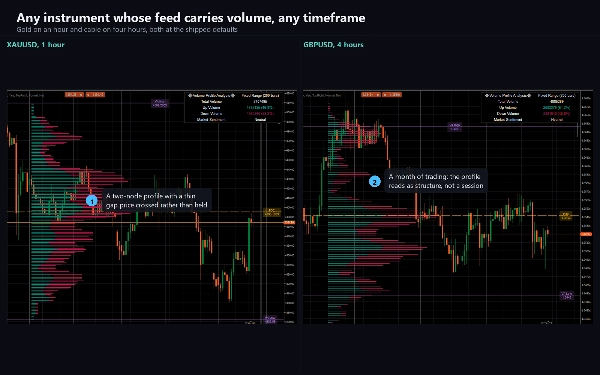
أي إطار زمني. هو أكثر فائدة داخل اليوم، من M5 إلى H4، حيث توزيع حجم الجلسة هو كائن ذو معنى.


يعمل على أي أداة تحمل حجم في تغذيتها. في الفوركس هذا هو حجم التيك، عدد تحديثات السعر لكل شريط، وهو بديل للنشاط بدلاً من الحجم المتداول. في عقود الفروقات للمؤشرات والسلع يوفر بعض الوسطاء حجم تبادل حقيقي، ويكون الملف أكثر معنى هناك. على أداة بدون حجم على الإطلاق، لا يتم رسم شيء.


لمن هو


المتداولون الذين يعملون بالفعل مع ملفات الحجم ويريدون واحداً بشبكة ثابتة قابلة للتعديل وانقسام واضح بين الشراء والبيع، بدلاً من ملف جلسة ثابتة.


تجربة


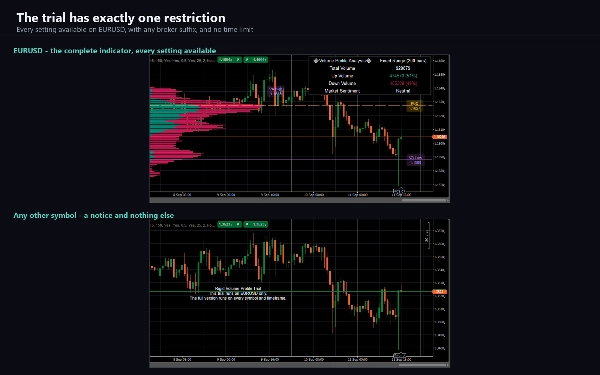
نسخة تجريبية مرفقة مع هذا المنتج. هي المؤشر الكامل مع كل الإعدادات متاحة، مقيدة على EURUSD. النسخة الكاملة تزيل هذا القيد ولا تضيف شيئاً آخر.


ملاحظات فنية وقيود


يُعاد حساب الملف عند كل تيك للشريط المتشكل، لذا تتحرك نقطة السيطرة ومنطقة القيمة داخل الشريط وتستقر عند إغلاقه. هذا مقصود. لا شيء هنا إشارة لشريط مغلق.


عند دقة الملف فوق 166 لا يتم رسم أدنى مستويات السعر. هذا حد مقصود للتصميم، الذي يحجز مجموعة ثابتة من كائنات الرسم ويستخدم ثلاثة لكل مستوى سعر؛ تبديل عرض خط POC وعرض منطقة القيمة يحرر كل واحد. احتفظ بدقة الملف عند 166 أو أقل لرؤية الملف الكامل.


تُبنى منطقة القيمة بترتيب المستويات حسب الحجم وأخذها بهذا الترتيب حتى الوصول إلى 70%، ثم الإبلاغ عن أعلى وأدنى سعر بينها. لذلك عادة ما تكون أوسع من منطقة قيمة تُبنى بالمشي من نقطة السيطرة إلى الخارج.


لأن الملف يُبنى من حجم وسيطك، فلن ينتج وسيطان ملفاً متطابقاً من نفس السوق.


حقوق الوصول هي لا شيء: المؤشر لا يضع أوامر، لا يعدل شيئاً، ولا يقرأ بيانات الحساب.


الدعم


توثيق يغطي كل معلمة، والإعدادات التي تفاجئ الناس، ودليل استكشاف الأخطاء يأتي مع المنتج. الأسئلة مرحب بها عبر تبويب النقاش؛ تقرير مفيد يذكر الرمز، الوسيط، الإطار الزمني، نسخة cTrader والإعدادات التي تم تغييرها عن الافتراضي.


التداول ينطوي على مخاطر. الأداء السابق لا يضمن النتائج المستقبلية.

الملخص

ملخص الذكاء الاصطناعي
Rigid Volume Profile is a chart overlay indicator that displays a fixed-grid volume profile over a chosen lookback period, dividing the price range into a set number of levels. It visualizes the volume traded at each price level, split into bullish volume (from bars that closed higher) and bearish volume (from bars that closed lower), with volume from unchanged bars split evenly. The indicator highlights the Point of Control—the price level with the highest traded volume—and marks the value area boundaries that encompass 70% of total volume. A volume analysis table provides total, up, and down volume percentages along with a sentiment reading based on dominant volume side.

Users can customize the lookback period (50 to 2000 bars), profile resolution (50 to 400 levels), display mode (side by side, stacked, split), profile width, and volume filtering. The profile updates dynamically on every tick of the forming bar. It supports any timeframe and instruments with volume data, including tick volume for forex and real exchange volume for some CFDs. The indicator is intended for traders familiar with volume profiles seeking detailed buying and selling pressure insights on a fixed grid rather than session-based profiles. A trial version is available with full features restricted to EURUSD.
ملف تعريف المؤشر
فئة المؤشر
الحجم
نوع المخرجات
التصور
متطلبات البيانات
أعمدة السعر فقط
الحجم
الإشارات المدعومة
لمس المستوى
كسر المستوى

مناقشة

تقييمات العملاء

0.0
التقييمات: 0
تقييمات العملاء
لا توجد تقييمات لهذا المنتج حتى الآن. هل جرَّبته بالفعل؟ كن أول من يخبر الآخرين!

الأسئلة الشائعة

Key Levels
Volume
Support & Resistance
يتم توفير المنتجات المتاحة من خلال cTrader Store، بما في ذلك روبوتات التداول والمؤشرات والإضافات، من قبل مطوري الطرف الثالث وإتاحتها لأغراض الوصول المعلوماتي والفني فقط. cTrader Store ليس وسيطًا ولا يقدم نصائح استثمارية أو توصيات شخصية أو أي ضمان للأداء المستقبلي.

المزيد من هذا المؤلف

مؤشر
ATR
EMA
+3
EMA cross filtered by a trend average and its ATR channel, with long, short and close marks and colored candles.
شعار "Bullion Horizon"
إحصائيات مباشرة
$97
/
$147
cBot
Balanced
Fixed Lot
+5
Gold grid cBot for XAUUSD H1: four-signal confluence on closed bars, ladders closed at a basket profit, news filter
15.6%
العائد على الاستثمار
2.33
عامل الربح
مؤشر
ATR
CCI
+4
A trend line that never steps back, a shaded band to the price, and a pointer at the swing where the trend turns.
مؤشر
ADX
ATR
+5
EMA-cross signals scored on six confluence layers, with an ATR stop, three targets and a live panel
مؤشر
ATR
RSI
+5
Fusion trend line with a layered cloud, BULL and BEAR labels, scored re-entry triangles and exit markers.
مؤشر
ATR
RSI
+4
Adaptive Ichimoku with nine-factor confluence scoring, five signal types, smart TP/SL and an MTF panel.
مؤشر
ATR
RSI
+4
RSI bands drawn on price, confluence-scored BUY/SELL signals, an ATR stop with three targets
مؤشر
ADX
ATR
+5
SuperTrend signals scored on five confluence factors, with an ATR stop, three targets and a dashboard.
مؤشر
ADX
ATR
+5
Ten confluence layers scored on every closed bar, with an anti-chop gate, pivot levels and a live dashboard.
شعار "QuotientDrift"
إحصائيات مباشرة
$97
/
$147
cBot
TP Manager
Break Even
+5
Gold cBot for prop-firm accounts: pick your firm, phase and size; risk is sized from the firm's rules, its limits kept
1.6
عامل الربح
مؤشر
ATR
EMA
+2
Eight-EMA ribbon with ATR trade zones, a nine-symbol screener and a five-timeframe trend dashboard.
مؤشر
ATR
Volume
+3
Fibonacci trend signals on closed bars, with an ATR stop, up to four targets and a break-even ladder.

قد يعجبك أيضًا

مؤشر
Fair Value Gap
Liquidity Grab
+2
PRO Liquidity Sweep + FVG Combo detector with custom Gold/Blue signals & alerts
مؤشر
Volume
Key Levels
+1
Order book indicator .Don't trade against the flow. Trade with the truth!
مؤشر
Prop
Forex
+5
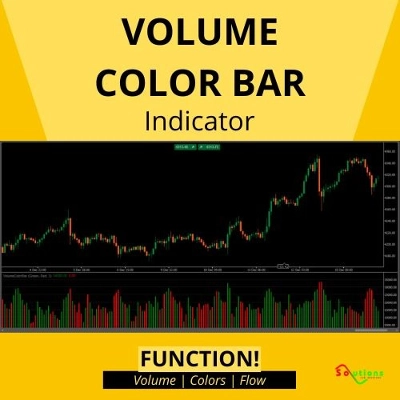
Color Volume Bars – Visualize Market Strength Instantly
شعار "ZigZagSmartAlert"
الأعلى تقييمًا
4.2
(4)
$19
/
$30
مؤشر
ZigZag Smart Alert for cTrader Description: ZigZag Smart Alert is a next-generation swing indicator for cTrader, designe
مؤشر
ATR
RSI
+5
Multi-factor VWAP mean-reversion signals with ATR bands, volume exhaustion, and RSI gate on cTrader.
مؤشر
AI
Forex
+5
Dynamic, color‑coded candles reveal market shifts instantly—spot momentum and trend reversals at a glance
مؤشر
Forex
EURUSD
+3
ATR-normalized MA slope in degrees, comparable across all instruments. Color-coded labels flag strong trend moves.
مؤشر
Signal
Supertrend
Multi-symbol multi-timeframe SuperTrend panel with watchlist, one-click jump, and alerts.
شعار "Equity and Balance"
الأعلى تقييمًا
4.4
(5)
$19
/
$35
مؤشر
Prop
Forex
+4
Displays real-time balance, equity, P&L, margin metrics directly on your charts.
مؤشر
ATR
Channel
Reversal Trap Probability Bands plots a dynamic volatility envelope around price & automatically detects "trap" reversal
مؤشر
Smoothed CCI alerts! Audio & arrow signals for +/-100 crosses. Custom sounds & arrow filters. Precision trading!
مؤشر
AI
ATR
+23
Candle Timer best used for Scalper
مؤشر
Prop
Forex
+5
Higher TimeFrame Candle Tracker: Current Timeframe (Any TimeFrame) Show High TimeFrame Candle Bar
مؤشر
Forex
BTCUSD
+11
Visualize trends with Standard Deviation Channel! Display median, and add customizable upper/lower deviation channels.
مؤشر
ATR
RSI
+1
Super Trend Rsi ,ATR + trend change distance + dynamic Alpha, divergence/convergence
مؤشر
ZigZag Pro – Multi-Swing Indicator for cTrader Description: ZigZag Pro is a powerful and fully customizable swing indica
مؤشر
VWAP
Volume
+5
Multi VWAP. Three timeframes. One clean chart. Your Essential Trading Tool.
مؤشر
VWAP
Volume
+5
The MA Quant Volume Profile Custom Range is a trading indicator that analyzes volume distribution across the price.

السعر

15
المبيعات
299
التثبيتات المجانية