
Deskripsi
Reverse RSI Phantom membalikkan RSI secara terbalik. Alih-alih menggambar osilator di panel di bawah
grafik, ini menyelesaikan rumus RSI secara terbalik dan mengajukan pertanyaan yang berbeda: harga berapa yang akan menempatkan
RSI tepat pada 70, dan harga berapa yang akan menempatkannya pada 30? Dua harga tersebut digambar pada grafik sebagai
pita, dan mereka bergerak dengan setiap bar.
Perubahan itu menempatkan seluruh osilator pada skala harga, di mana Anda dapat melihatnya terhadap
lilin, terhadap level Anda, dan terhadap rencana yang digambar indikator untuk Anda.
APA YANG DIGAMBAR
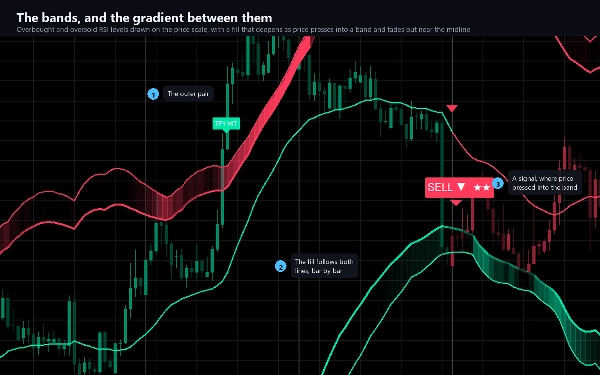
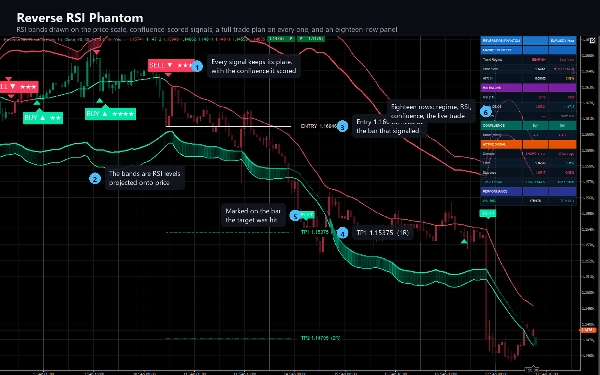
- Dua pita dan tepi luarnya, pada level overbought dan oversold yang Anda pilih, diproyeksikan ke
harga dan opsional dilunakkan.
- Isi gradasi di dalam setiap pita yang semakin dalam saat harga menekan ke dalamnya dan memudar sepenuhnya
di dekat garis tengah, sehingga grafik memberi tahu Anda di mana tekanannya tanpa satu angka pun.
- Garis tengah yang membawa warna rezim tren.
- Lilin yang diberi warna oleh rezim yang sama, sehingga arah dapat dibaca sekilas.
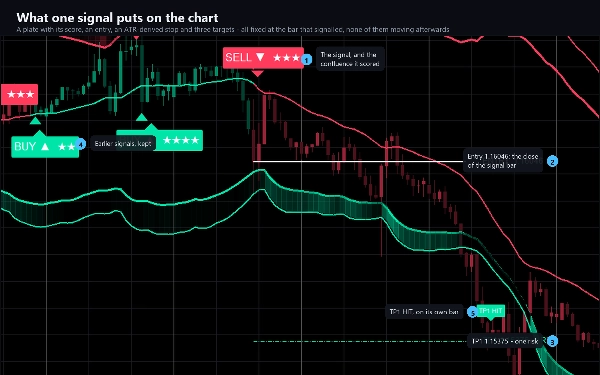
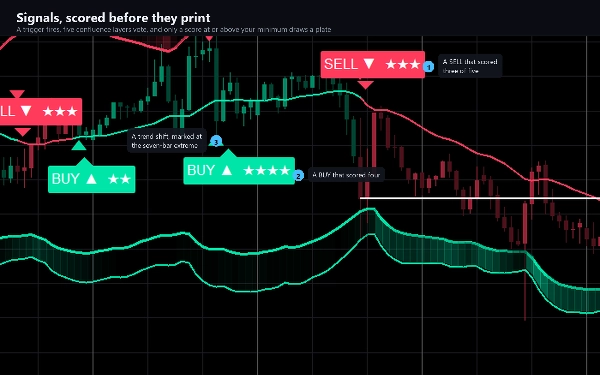
- Sebuah pelat pada setiap bar sinyal - BELI atau JUAL - dengan konfluensi yang diperolehnya, dari lima.
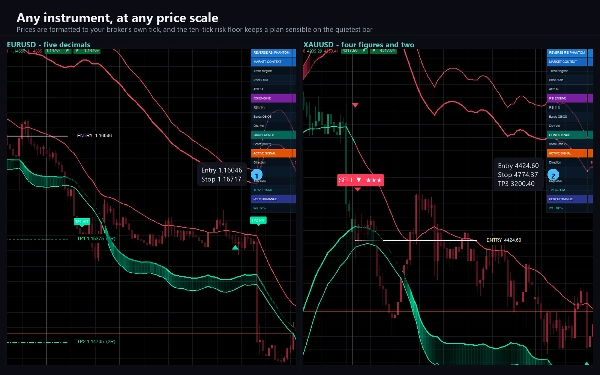
- Rencana perdagangan lengkap pada bar sinyal: entri, stop yang diturunkan dari ATR, dan tiga target pada kelipatan risiko
yang Anda tetapkan. Lima garis dan lima label harga, semuanya tetap pada bar yang memberi sinyal.
- Sebuah pelat pada bar yang mencapai setiap target, dan pada bar yang menyentuh stop.
- Segitiga di mana rezim tren berbalik, dan tanda di mana RSI menyimpang dari harga.
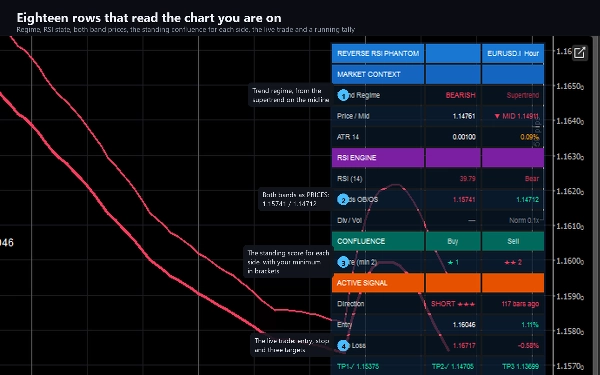
- Panel delapan belas baris: rezim, harga terhadap garis tengah, ATR, RSI dan statusnya, kedua pita sebagai
harga, divergensi, volume, konfluensi yang berdiri untuk setiap sisi, perdagangan langsung dengan entri,
stop dan tiga target, dan perhitungan berjalan dari apa yang dilakukan sejarah grafik.
BAGAIMANA MEMUTUSKAN
Sebuah sinyal bukanlah satu kondisi. Sebuah pemicu menyala - rezim berbalik, harga menyeberangi pita, atau
divergensi mengonfirmasi - dan kemudian lima lapisan konfluensi memilih: rezim, konfirmasi RSI, retest pita, divergensi, dan pemeriksaan volume. Skornya 0 sampai 5, ditampilkan sebagai bintang pada pelat, dan
harus mencapai minimum yang Anda tetapkan sebelum apa pun digambar. Gerbang tren dan pendinginan per arah
menyaring apa yang tersisa, dan jika kedua sisi memenuhi syarat pada bar yang sama skor yang lebih tinggi yang menang.
Mode Non-Repaint aktif secara default: sebuah bar dinilai hanya setelah ditutup, sehingga pelat yang tercetak
tidak pernah bergerak dan tidak pernah hilang.
PENGATURAN UTAMA
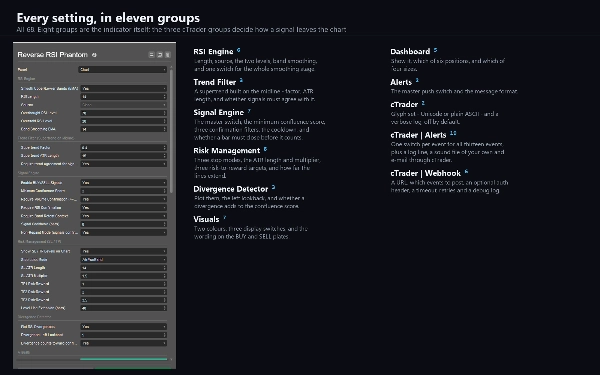
68 dalam sebelas grup. Panjang RSI, sumber dan dua level; pelunakan pita; faktor filter supertrend dan panjang ATR; skor konfluensi minimum dan tiga filter konfirmasi; pendinginan sinyal; tiga mode stop dengan panjang dan pengali ATR; tiga target risiko-imbalan; lookback divergensi; dua warna dan kata-kata pada pelat; posisi dan ukuran panel; dan tiga grup khusus cTrader untuk peringatan dan webhook.
PERINGATAN DAN WEBHOOK
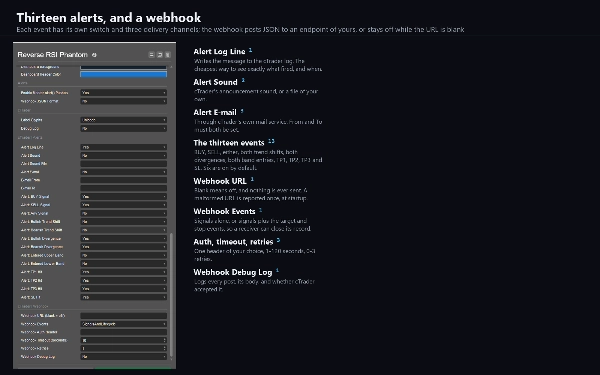
Tiga belas peristiwa, masing-masing dengan saklar sendiri: BELI, JUAL, salah satu, kedua pergeseran tren, kedua divergensi, kedua entri pita, ketiga target dan stop. Dikirim sebagai baris log cTrader, suara pilihan Anda, dan e-mail. Tidak ada yang menyala saat indikator berjalan melalui sejarah grafik, dan tidak ada yang menyala dalam backtest.
Sebuah webhook mengirimkan peristiwa yang sama sebagai JSON ke alamat mana pun yang Anda pilih - bot perdagangan, jurnal, relay, alur otomatisasi. Ini tetap mati sampai Anda memasukkan satu, dideduplicasi per peristiwa per bar, dibatasi hingga dua puluh pesan per menit, dan kegagalan dicatat daripada dilempar. Ini mengirim melalui layanan jaringan cTrader sendiri, itulah sebabnya indikator tidak memerlukan hak akses file atau jaringan sama sekali.
JENIS DAN JENDELA
Indikator overlay: semuanya digambar pada grafik harga, dan tidak menambahkan panel terpisah.
KERANGKA WAKTU DAN INSTRUMEN
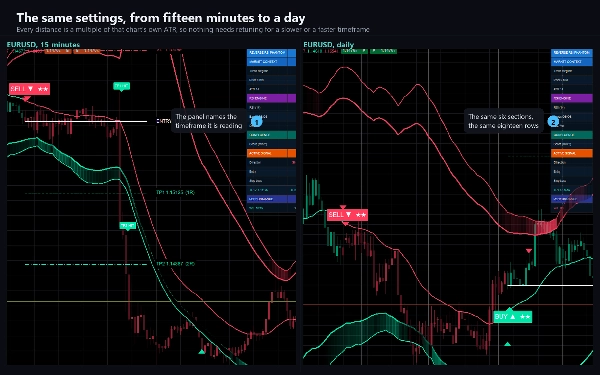
Apa saja. Setiap jarak yang digambar adalah kelipatan dari ATR grafik itu sendiri, dan harga diformat sesuai tick broker Anda, jadi tidak perlu penyesuaian ulang antara grafik lima belas menit dan harian, atau antara pasangan FX lima desimal dan emas empat digit. M15 hingga H4 adalah rentang di mana sebagian besar pengujian dilakukan.
Volume diperlukan: salah satu dari lima lapisan konfluensi membacanya.
KASUS PENGGUNAAN
- Membaca tekanan overbought dan oversold di tempatnya, pada skala harga.
- Mengambil entri mean-reversion pada pita dengan rezim tren sebagai filter.
- Mengubah sinyal menjadi rencana: satu stop dan tiga target, digambar sebelum Anda bertindak.
- Mengamati satu grafik dan diberitahu, melalui baris log, suara, e-mail atau webhook, saat sesuatu terjadi.
UNTUK SIAPA
Trader yang sudah menggunakan RSI dan menginginkannya di tempat mata mereka melihat, dan siapa saja yang menginginkan sinyal yang datang dengan stop dan serangkaian target daripada panah.
UJI COBA
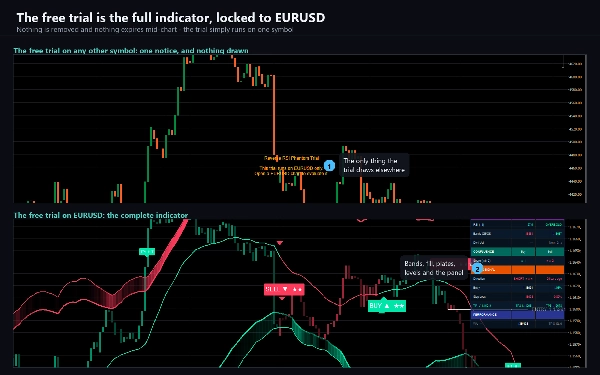
Uji coba gratis adalah indikator penuh hanya pada EURUSD - setiap suffix broker berfungsi. Pada simbol lain
menampilkan pemberitahuan dan tidak menggambar apa pun. Tidak ada batas waktu, tidak ada riwayat yang dikurangi, tidak ada fitur yang hilang. Versi penuh menghapus pembatasan simbol dan tidak mengubah apa pun selain itu.
CATATAN TEKNIS DAN BATASAN
Hak akses: tidak ada. Indikator tidak dapat membaca file, memulai proses, atau membuka koneksi sendiri.
Ini adalah alat grafik dan analisis. Ini tidak menempatkan order dan tidak memiliki akses ke akun Anda.
Baris KINERJA panel menghitung apa yang terjadi pada bar yang telah dimuat grafik Anda di bawah pengaturan saat ini. Ini adalah deskripsi dari sejarah tersebut, bukan backtest dan bukan ramalan.
Mematikan filter konfirmasi meningkatkan skor konfluensi daripada menurunkannya - tiga dari lima lapisan memberikan poin mereka saat filter mereka dinonaktifkan. Tingkatkan skor minimum sesuai jika Anda mematikan filter.
DUKUNGAN
Pertanyaan diajukan melalui tab Diskusi. Sertakan broker, simbol, kerangka waktu, versi cTrader dan
tangkapan layar, dan Anda akan mendapatkan jawaban yang berguna pada percobaan pertama.
Perdagangan melibatkan risiko. Kinerja masa lalu tidak menjamin hasil di masa depan.
Ringkasan
Key features include:
- Two price bands representing RSI thresholds with gradient fills indicating pressure intensity.
- A midline and candle tinting reflecting the current trend regime.
- Confluence-scored BUY and SELL signals displayed on signal bars with a score out of five.
- A comprehensive trade plan per signal, showing entry, an ATR-based stop loss, and three customizable profit targets.
- Visual markers for trend regime changes and RSI-price divergences.
- An 18-row informational panel summarizing regime, ATR, RSI states, volume, confluence, active trades, and historical performance.
- Configurable settings covering RSI parameters, smoothing, trend filters, confluence thresholds, stop modes, risk targets, divergence lookback, and alert/webhook options.
The indicator operates as an overlay on any instrument and timeframe, requiring volume data for full functionality. Alerts and webhooks can notify users of key events such as signals, trend shifts, targets, and stops. Non-repaint mode ensures signals are fixed once bars close. It is designed for traders who use RSI and seek integrated signals with trade management guidance.
Ulasan pelanggan
5 | 100 % | |
4 | 0 % | |
3 | 0 % | |
2 | 0 % | |
1 | 0 % |