present
Inscrivez-vous et bénéficiez d'une remise de 50 $ sur votre premier achat
Trading product for Alpha Pointer Indicateur EMA SMA, image 1
Alpha Pointer
Indicateur
114 téléchargements
Version 1.0, Sep 2026
Windows, Mac
5.0
Avis : 3
Trading product for Alpha Pointer Indicateur EMA SMA, image 2
Trading product for Alpha Pointer Indicateur EMA SMA, image 3
Trading product for Alpha Pointer Indicateur EMA SMA, image 4
Trading product for Alpha Pointer Indicateur EMA SMA, image 5
Trading product for Alpha Pointer Indicateur EMA SMA, image 6
Trading product for Alpha Pointer Indicateur EMA SMA, image 7
Trading product for Alpha Pointer Indicateur EMA SMA, image 8
Trading product for Alpha Pointer Indicateur EMA SMA, image 9
Trading product for Alpha Pointer Indicateur EMA SMA, image 10
Trading product for Alpha Pointer Indicateur EMA SMA, image 11
15
Ventes
328
Installations gratuites

Description

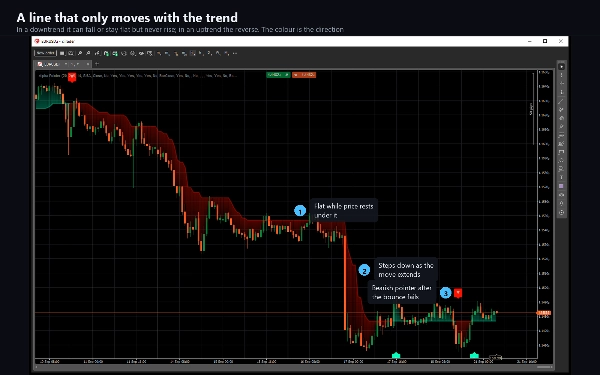
Alpha Pointer place une ligne sur le graphique qui ne bouge qu'avec la tendance.


À chaque barre, il mesure la moyenne de la vraie amplitude et fixe un niveau sous la barre en tendance haussière, ou au-dessus de la barre en tendance baissière. Le côté utilisé est décidé par l'indice de canal des matières premières (Commodity Channel Index). Tant que le momentum est positif, le niveau suit le prix vers le haut et ne baisse jamais ; tant que le momentum est négatif, il suit le prix vers le bas et ne monte jamais. Le résultat est une ligne en marches sur laquelle vous pouvez vous appuyer : tant qu'elle tient, le mouvement qui l'a construite est intact.


CE QUE VOUS VOYEZ


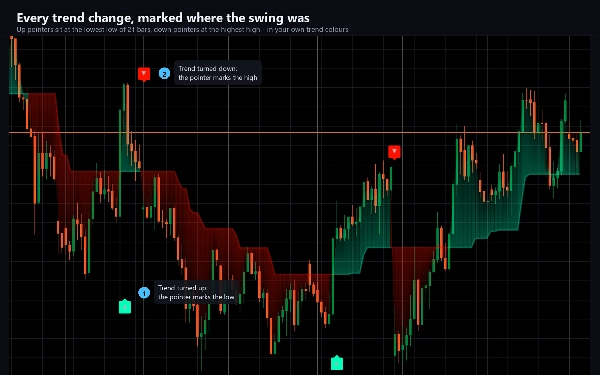
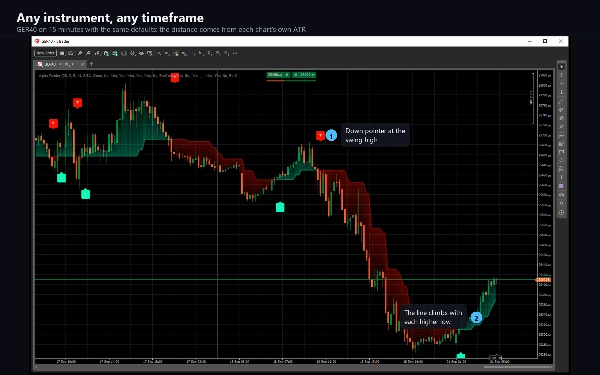
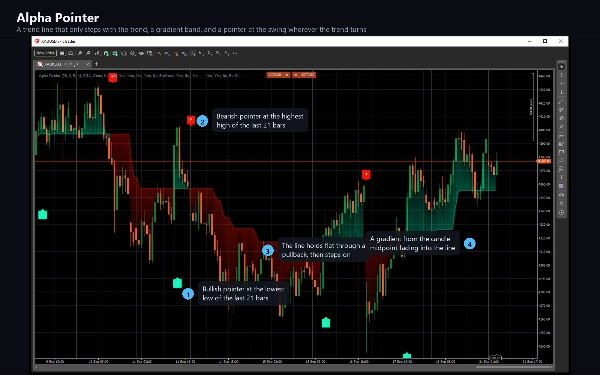
Une ligne de tendance en marches, dans votre couleur haussière ou baissière.

Une bande ombrée entre cette ligne et le milieu de chaque barre, plus claire à la barre et plus forte à la ligne, de sorte que la distance parcourue par le prix soit lisible d'un coup d'œil.

Un pointeur sur la barre où la tendance tourne, placé au plus bas ou au plus haut des 21 dernières barres, là où le mouvement a commencé.


COMMENT L'UTILISER


La ligne est la tendance et un niveau contre lequel trader : tant que le prix reste au-dessus, les acheteurs contrôlent, et en dessous, ce sont les vendeurs. Un pointeur marque le retournement lui-même, c'est donc un point de départ pour chercher une entrée, pas une entrée en soi. Une longue portion plate de ligne signifie que le prix évolue dans la bande et qu'il n'y a rien sur quoi s'appuyer.


PARAMÈTRES


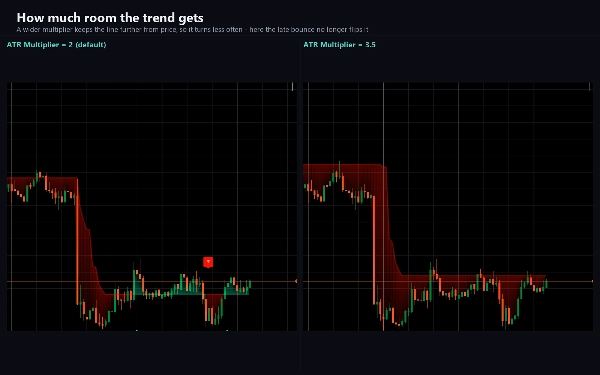
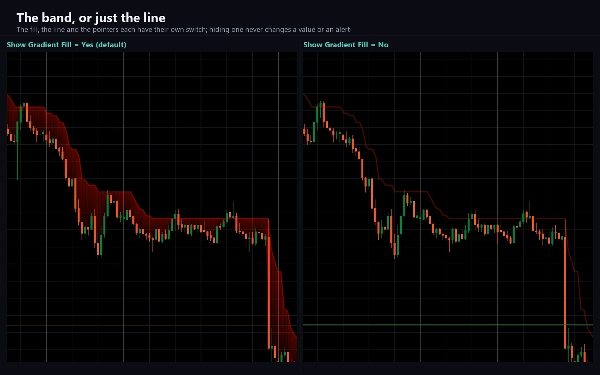
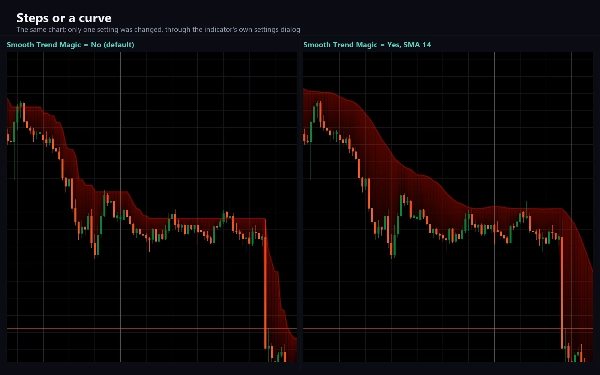
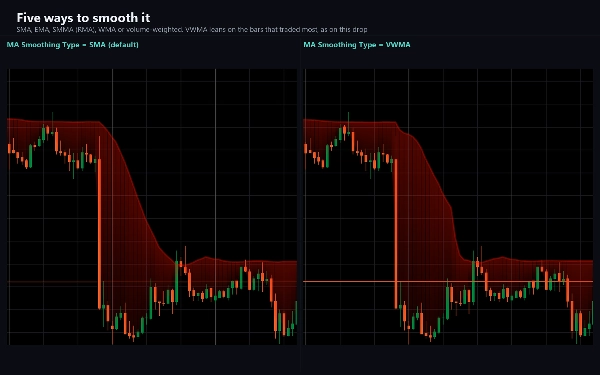
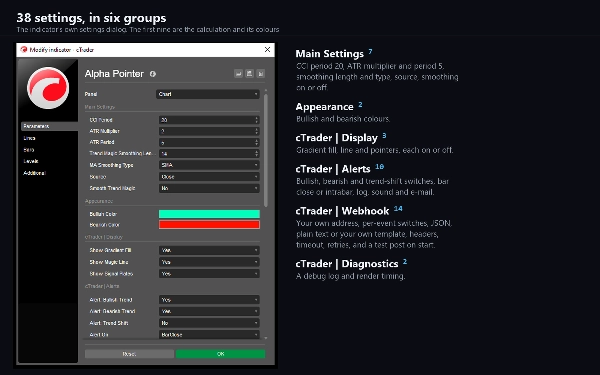
La période CCI, la période ATR et le multiplicateur ATR déterminent la distance de la ligne par rapport au prix et la rapidité de ses retournements. Smooth Trend Magic fait passer la ligne par une moyenne mobile de votre choix - SMA, EMA, SMMA, WMA ou VWMA - ce qui donne une ligne plus calme qui tourne plus tard. Les deux couleurs sont personnalisables. La bande, la ligne et les pointeurs ont chacun un interrupteur, et désactiver l'un d'eux change uniquement le dessin : les valeurs, alertes et webhook continuent de fonctionner.


ALERTES ET WEBHOOK


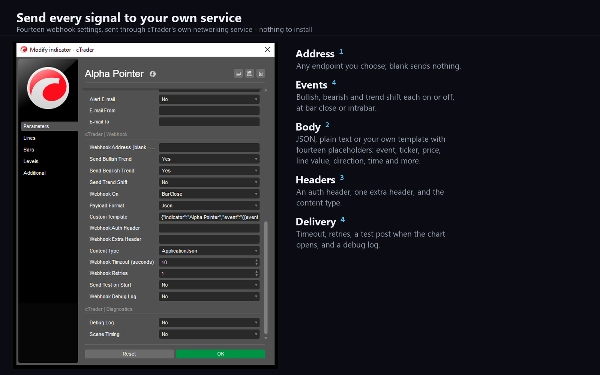
Trois événements : un retournement à la hausse, un retournement à la baisse, et tout changement de direction. Chacun a son propre interrupteur et peut se déclencher à la clôture de la barre ou dès que la condition est remplie. La livraison peut être une ligne de journal, un son ou un e-mail. Il y a aussi un webhook : entrez une adresse et chaque événement y est envoyé en JSON, en texte brut, ou dans un modèle que vous écrivez vous-même avec des espaces réservés pour le symbole, la période, l'heure, les prix, la ligne et la direction. Il reste désactivé tant que vous n'en entrez pas un, n'envoie rien pendant le passage de l'historique ou en backtest, et ne nécessite aucun droit d'accès spécial - les envois passent par le service réseau propre à cTrader.


TYPE ET FENÊTRE


Un indicateur de tendance, dessiné sur le graphique des prix.


PÉRIODES ET INSTRUMENTS


Toute période basée sur le temps. M15 et plus conviennent aux paramètres par défaut ; sur M1 et M5, baissez la période CCI ou augmentez le multiplicateur ATR pour que la ligne tourne moins souvent. Il fonctionne sur n'importe quel instrument - paires forex, métaux, indices et crypto - car tout ce qu'il utilise est dérivé des barres elles-mêmes.


POUR QUI C'EST


Les traders qui suivent une tendance et veulent un niveau clair pour celle-ci, avec un marqueur à chaque retournement et une alerte quand cela se produit.


REMARQUES


Tout sur le graphique suit la barre encore en formation, donc la ligne, la bande et un pointeur peuvent changer jusqu'à la clôture de cette barre. Les alertes et les envois webhook par défaut se font à la clôture de la barre, où la condition est définitive. Sur un graphique neuf, la ligne peut rester à zéro jusqu'au premier retournement positif du momentum ; revenez en arrière ou attendez le premier retournement et elle prendra sa place normale.


Le trading comporte des risques. Les performances passées ne garantissent pas les résultats futurs.

Résumé

Résumé IA
Alpha Pointer is a trend indicator designed for use on price charts across any time-based timeframe and instrument, including forex, metals, indices, and cryptocurrencies. It plots a stepped trend line that moves only with the prevailing trend, never stepping back. This line is calculated each bar using the Average True Range (ATR) and positioned below the bar in an uptrend or above in a downtrend, with direction determined by the Commodity Channel Index (CCI). The indicator also displays a shaded band between the trend line and the midpoint of each bar, visually representing the distance price has moved. A pointer marks the swing bar where the trend reverses, located at the lowest low or highest high of the last 21 bars, indicating where the move began.

Users can customize settings such as CCI period, ATR period, ATR multiplier, and smoothing methods (SMA, EMA, SMMA, WMA, VWMA) to adjust the line’s sensitivity and appearance. The indicator supports alerts and webhook notifications for trend turns and direction changes, configurable to trigger on bar close or immediately when conditions occur. Alpha Pointer serves as a clear visual guide for traders to identify trend direction and key levels to trade against, with the trend line acting as support or resistance depending on price position.
Profil de l'indicateur
Catégorie de l'indicateur
Tendance
Type de résultat
Visualisation
Signaux
Exigences en matière de données
Barres seulement
Signaux pris en charge
Inversion

Discussion

Avis clients

5.0
Avis : 3
5
100 %
4
0 %
3
0 %
2
0 %
1
0 %
Avis clients
October 27, 2026
the combination of a steady trend line and a swing pointer is nicely thought through. ATR sets the line and CCI steers direction, with smoothing available for a different pace. Historical pointers sit at the swing itself, not necessarily where confirmation arrived.
October 11, 2026
Alpha Pointer provides a clear stepped trend level with bullish/bearish shading and turn markers. Testing on EURUSD and XAUUSD across H1 and M1 showed stable rendering, coherent directional changes and good readability. Alert and webhook controls are present, while delivery was not exercised
October 8, 2026
A stepped ATR line with CCI steering direction is a neat way to keep the trend readable. Periods and smoothing can be adjusted around the M15 and above defaults. The reversal pointer sits back at the swing itself, so its chart position and confirmation time need reading separately.

Questions fréquentes

EMA
SMA
Channel
ATR
Moving Average
CCI
Les produits disponibles sur cTrader Store, notamment les bots de trading, les indicateurs et les plug-ins, sont fournis par des développeurs tiers et mis à disposition à titre informatif et à des fins d'accès technique uniquement. cTrader Store n'est pas un courtier et ne fournit aucun conseil en investissement, aucune recommandation personnelle ni aucune garantie quant aux performances futures.

Plus de cet auteur

Indicateur
ATR
EMA
+3
EMA cross filtered by a trend average and its ATR channel, with long, short and close marks and colored candles.
Logo de "Bullion Horizon"
Statistiques en direct
5.0
(2)
$97
/
$147
cBot
Balanced
Fixed Lot
+5
Gold grid cBot for XAUUSD H1: four-signal confluence on closed bars, ladders closed at a basket profit, news filter
15.6%
ROI
2.33
Facteur de profit
Indicateur
ATR
RSI
+5
Fusion trend line with a layered cloud, BULL and BEAR labels, scored re-entry triangles and exit markers.
Indicateur
ATR
RSI
+4
Adaptive Ichimoku with nine-factor confluence scoring, five signal types, smart TP/SL and an MTF panel.
Indicateur
ATR
RSI
+4
RSI bands drawn on price, confluence-scored BUY/SELL signals, an ATR stop with three targets
Indicateur
ADX
ATR
+5
EMA-cross signals scored on six confluence layers, with an ATR stop, three targets and a live panel
Indicateur
ATR
EMA
+4
Range-filter BUY/SELL signals scored by four confluence layers, with a stop, five targets and a trend panel
Indicateur
ADX
ATR
+5
Ten confluence layers scored on every closed bar, with an anti-chop gate, pivot levels and a live dashboard.
Indicateur
ATR
Volume
+3
Fibonacci trend signals on closed bars, with an ATR stop, up to four targets and a break-even ladder.
Indicateur
ADX
ATR
+5
SuperTrend signals scored on five confluence factors, with an ATR stop, three targets and a dashboard.
Logo de "QuotientDrift"
Statistiques en direct
5.0
(1)
$97
/
$147
cBot
TP Manager
Break Even
+5
Gold cBot for prop-firm accounts: pick your firm, phase and size; risk is sized from the firm's rules, its limits kept
1.6
Facteur de profit
Indicateur
ATR
EMA
+2
Eight-EMA ribbon with ATR trade zones, a nine-symbol screener and a five-timeframe trend dashboard.

Vous pourriez aussi aimer

Indicateur
Moving Average
Support & Resistance
Adaptive, low-lag moving average designed to smooth noise while responding quickly to changing market conditions.
Indicateur
BOS
Fibonacci
+4
Automatically draws major trading sessions, killzones, and SMC daily liquidity targets directly on your cTrader charts.
Indicateur
SMC
Forex
+5
ICT liquidity engine for Gold: maps stop clusters, scores zones & projects the next target. Now with 4 ICT killzones.
Indicateur
ATR
EMA
+5
Candle timer with live profit tracking on chart – displays pips, currency value, and percentage in real time.
Indicateur
ATR
BOS
+5
Market structure with BOS and CHoCH, order blocks, and retest buy/sell arrows with entry, stop and two targets
Indicateur
ATR
Prop
+6
🟢 Strength-ranked S/R zones with MTF levels and Pro labels. Nearest-zone band and HUD for faster, cleaner entries. 🔴
Indicateur
EMA
RSI
+4
🚀📈 Plot buy/sell signals on Range Bars using Moving Averages and RSI. Clear, actionable trading insights.🚀📈
Indicateur
ATR
BOS
+5
Opening ranges, dynamic trend channels, and multi-scale breakout/retest analysis for clear intraday chart decisions.
Indicateur
Forex
Crypto
+2
HTF Candle
Indicateur
ATR
Key Levels
+1
Explore 88 harmonic price-pattern variants with interactive chart controls and geometric reference levels.
Indicateur
Forex
Crypto
+3
Track major trading sessions (Tokyo, London, New York) with customizable colors and visual sessions on your chart.
Indicateur
Imbalance
Key Levels
+5
Smart Money Concepts (SMC) indicator with real-time Fair Value Gap (FVG) boxes, $50 round numbers, and live market HUD.
Indicateur
Parabolic SAR Alert - Trend reversal alerts with smart signals & custom alerts.
Indicateur
Forex
BTCUSD
+11
VMM Average Median - Advanced Median Indicator with Smart Trend Detection.
Indicateur
RSI
Breakout
+1
📊 Visualize market trends more clearly and dynamically
Indicateur
Prop
Forex
+14
🚀See the market’s framework, decide faster. Session-Aware Pivots. Auto Presets. Pro-Grade Zones.🚀
Indicateur
Three ZigZag lines
Indicateur
Forex
Crypto
+4
Pro Heikin Ashi Visual Overlay – Clean Trend Visualization

Prix

15
Ventes
328
Installations gratuites