present
سجل واحصل على خصم 50 دولارًا على مشترياتك الأولى
Trading product for Reverse RSI Phantom مؤشر Supertrend Key Levels, image 1
Reverse RSI Phantom
مؤشر
1 عمليات الشراء
الإصدار 1.2، Sep 2026
Windows, Mac
5.0
التقييمات: 1
Trading product for Reverse RSI Phantom مؤشر Supertrend Key Levels, image 2
Trading product for Reverse RSI Phantom مؤشر Supertrend Key Levels, image 3
Trading product for Reverse RSI Phantom مؤشر Supertrend Key Levels, image 4
Trading product for Reverse RSI Phantom مؤشر Supertrend Key Levels, image 5
Trading product for Reverse RSI Phantom مؤشر Supertrend Key Levels, image 6
Trading product for Reverse RSI Phantom مؤشر Supertrend Key Levels, image 7
Trading product for Reverse RSI Phantom مؤشر Supertrend Key Levels, image 8
Trading product for Reverse RSI Phantom مؤشر Supertrend Key Levels, image 9
Trading product for Reverse RSI Phantom مؤشر Supertrend Key Levels, image 10
Trading product for Reverse RSI Phantom مؤشر Supertrend Key Levels, image 11
8
المبيعات
167
التثبيتات المجانية

الوصف

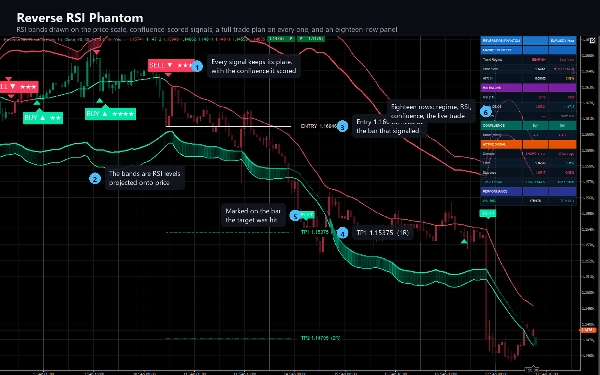
يعكس مؤشر RSI Phantom العكسي مؤشر RSI. بدلاً من رسم المؤشر في لوحة أسفل

الرسم البياني، فإنه يحل معادلة RSI بالعكس ويسأل سؤالًا مختلفًا: ما السعر الذي سيجعل

مؤشر RSI عند 70 بالضبط، وما السعر الذي سيجعلها عند 30؟ يتم رسم هذين السعرين على الرسم البياني كـ

أشرطة، وتتحرك مع كل شريط.


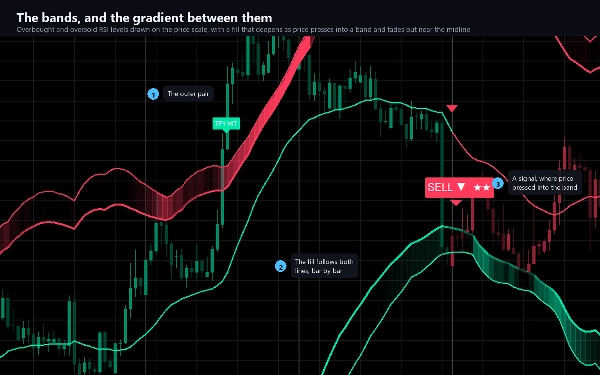
هذا التغيير الواحد يضع المؤشر بأكمله على مقياس السعر، حيث يمكنك رؤيته مقابل

الشموع، مقابل مستوياتك، وضد الخطة التي يرسمها المؤشر لك.


ما يرسمه


- شريطان وحوافهم الخارجية، عند مستويات الشراء المفرط والبيع المفرط التي تختارها، معروضة على

السعر ومُنعمة اختياريًا.

- تعبئة متدرجة داخل كل شريط تتعمق مع ضغط السعر عليه وتتلاشى تمامًا

بالقرب من الخط الأوسط، بحيث يخبرك الرسم البياني أين الضغط بدون رقم واحد.

- خط وسط يحمل لون نظام الاتجاه.

- شموع ملونة بنفس نظام الاتجاه، بحيث يكون الاتجاه قابلاً للقراءة بنظرة سريعة.

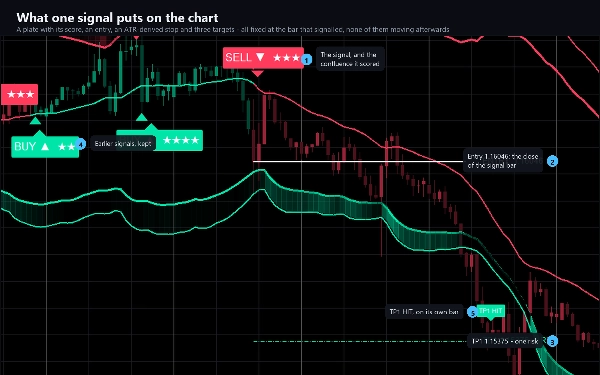
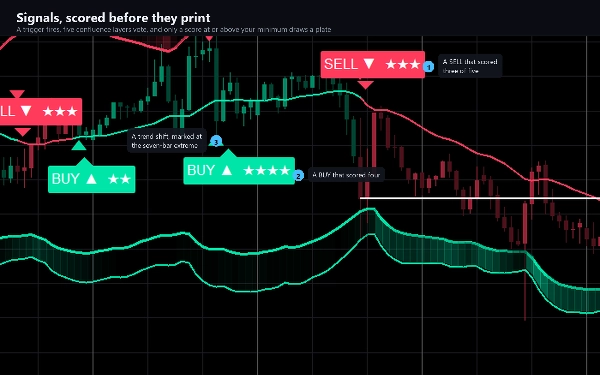
- لوحة على كل شريط إشارة - شراء أو بيع - مع التوافق الذي حصل عليه، من أصل خمسة.

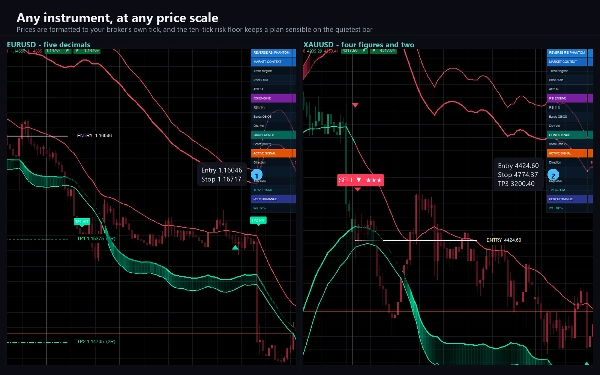
- خطة تداول كاملة على شريط الإشارة: الدخول، وقف خسارة مشتق من ATR، وثلاثة أهداف بمضاعفات المخاطرة

التي تحددها. خمسة خطوط وخمسة علامات سعر، كلها مثبتة عند الشريط الذي أشار.

- لوحة على الشريط الذي يصل إلى كل هدف، وعلى الشريط الذي يلمس الوقف.

- مثلثات حيث يتحول نظام الاتجاه، وعلامات حيث يتباعد RSI عن السعر.

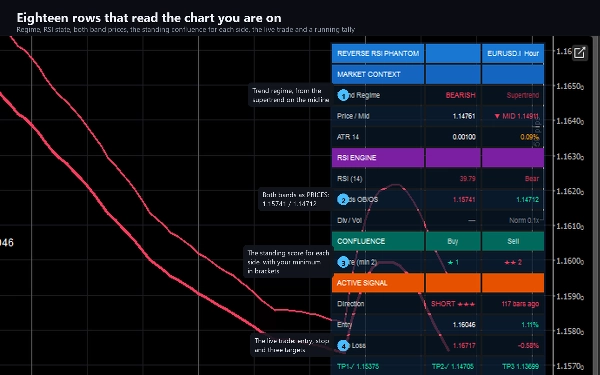
- لوحة مكونة من ثمانية عشر صفًا: النظام، السعر مقابل الخط الأوسط، ATR، RSI وحالته، كلا الشريطين كـ

أسعار، التباعد، الحجم، التوافق القائم لكل جانب، التداول الحي مع دخوله،

الوقف وثلاثة أهداف، وإجمالي متراكم لما فعله تاريخ الرسم البياني.


كيف يقرر


الإشارة ليست شرطًا واحدًا. يتم إطلاق الزناد - يتحول النظام، يعبر السعر شريطًا، أو

يتأكد التباعد - ثم يصوت خمسة طبقات توافق: النظام، تأكيد RSI، إعادة اختبار الشريط، التباعد، وفحص الحجم. النتيجة من 0 إلى 5، وتُعرض كنجوم على اللوحة،

ويجب أن تصل إلى الحد الأدنى الذي تحدده قبل رسم أي شيء. يقوم بوابة الاتجاه وفلتر التهدئة لكل اتجاه بتصفية ما تبقى، وإذا تأهل كلا الجانبين على نفس الشريط تأخذ النتيجة الأعلى.


وضع عدم إعادة الرسم مفعل افتراضيًا: يتم الحكم على الشريط فقط بعد إغلاقه، لذا فإن اللوحة التي تُطبع

لا تتحرك أبدًا ولا تختفي أبدًا.


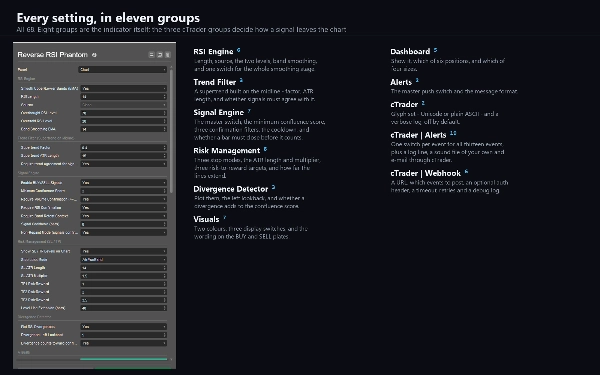
الإعدادات الرئيسية


68 في إحدى عشرة مجموعة. طول RSI، المصدر والمستويان؛ تنعيم الشريط؛ عامل فلتر السوبرتريند وطول ATR؛ الحد الأدنى لدرجة التوافق وثلاثة فلاتر تأكيد؛ تهدئة الإشارة؛ ثلاث أوضاع وقف مع طول ATR ومضاعف؛ ثلاثة أهداف نسبة المخاطرة إلى العائد؛ فترة التباعد؛ لونان والنص على اللوحات؛ موقع وحجم اللوحة؛ وثلاث مجموعات خاصة بـ cTrader للتنبيهات والويب هوك.


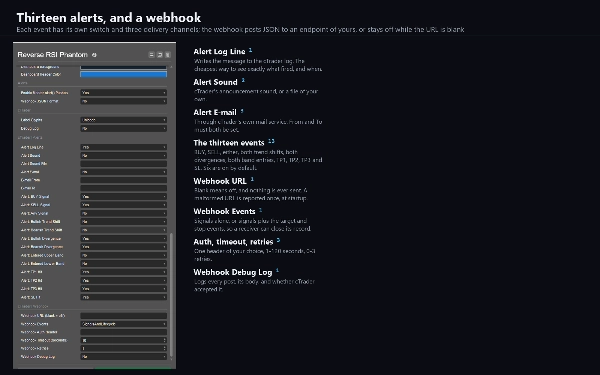
التنبيهات والويب هوك


ثلاثة عشر حدثًا، لكل منها مفتاح تشغيل خاص: شراء، بيع، أي منهما، كلا تحولات الاتجاه، كلا التباعدين، كلا دخول الشريطين، كل الأهداف الثلاثة والوقف. يتم تسليمها كسطر سجل في cTrader، وصوت من اختيارك، وبريد إلكتروني. لا يتم إطلاق أي شيء أثناء مرور المؤشر بتاريخ الرسم البياني، ولا يتم إطلاق أي شيء في اختبار رجعي.


يرسل الويب هوك نفس الأحداث كـ JSON إلى أي عنوان تختاره - بوت تداول، سجل، مرحل، تدفق أتمتة. يبقى مغلقًا حتى تدخل واحدًا، ويتم إزالة التكرار لكل حدث لكل شريط، ويقتصر على عشرين رسالة في الدقيقة، ويتم تسجيل الفشل بدلاً من رميه. يرسل عبر خدمة الشبكات الخاصة بـ cTrader، ولهذا السبب لا يحتاج المؤشر إلى حقوق وصول إلى الملفات أو الشبكة على الإطلاق.


النوع والنافذة


مؤشر تراكبي: كل شيء يُرسم على مخطط السعر، ولا يضيف لوحة منفصلة.


الأطر الزمنية والأدوات


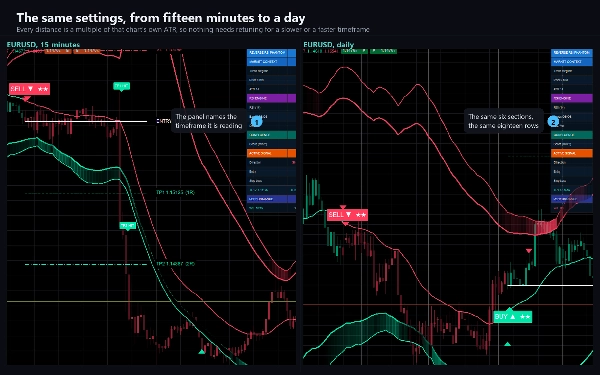
أي. كل مسافة يرسمها هي مضاعف لـ ATR الخاص بذلك الرسم البياني، ويتم تنسيق الأسعار حسب

التيك الخاص بالوسيط، لذا لا حاجة لإعادة الضبط بين مخطط خمس عشرة دقيقة ويومي، أو

بين زوج فوركس بخمسة أرقام عشرية وذهب بأربعة أرقام. النطاق من M15 إلى H4 هو النطاق الذي تم

اختبار معظمه.


الحجم مطلوب: واحدة من طبقات التوافق الخمس تقرأه.


حالات الاستخدام


- قراءة ضغط الشراء المفرط والبيع المفرط حيث ينتمي، على مقياس السعر.

- أخذ مداخل الانعكاس المتوسط عند شريط مع نظام الاتجاه كفلتر.

- تحويل إشارة إلى خطة: وقف واحد وثلاثة أهداف، مرسومة قبل أن تتصرف.

- مراقبة مخطط واحد وإعلامك، عبر سطر سجل، صوت، بريد إلكتروني أو ويب هوك، عندما يحدث شيء.


لمن هو


المتداولون الذين يستخدمون RSI بالفعل ويريدونه حيث تكون أعينهم، وأي شخص يريد إشارة تأتي

مع وقف خسارة ومجموعة أهداف بدلاً من سهم.


التجربة


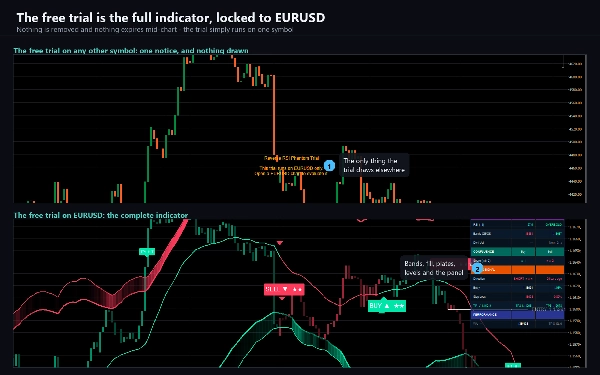
التجربة المجانية هي المؤشر الكامل على EURUSD فقط - كل لاحقة وسيط تعمل. على أي رمز آخر

يعرض إشعارًا ولا يرسم شيئًا. لا يوجد حد زمني، لا تاريخ مخفض، لا ميزات مفقودة. النسخة الكاملة

تزيل قيد الرمز ولا تغير أي شيء آخر.


ملاحظات فنية وقيود


حقوق الوصول: لا شيء. لا يمكن للمؤشر قراءة الملفات، بدء العمليات أو فتح الاتصالات بنفسه.


إنه أداة للرسم والتحليل. لا يضع أوامر وليس لديه وصول إلى حسابك.


صف أداء اللوحة يحصي ما حدث على الأشرطة التي تم تحميلها في الرسم البياني تحت إعداداتك الحالية. إنه وصف لذلك التاريخ، وليس اختبارًا رجعيًا ولا توقعًا.


إيقاف فلتر التأكيد يرفع درجة التوافق بدلاً من خفضها - ثلاث من الطبقات الخمس تمنح نقطتها عندما يتم تعطيل فلترها. ارفع الحد الأدنى للدرجة لتتناسب إذا قمت بإيقاف الفلاتر.


الدعم


تُطرح الأسئلة عبر تبويب المناقشة. أدرج وسيطك، الرمز، الإطار الزمني، نسخة cTrader و

لقطة شاشة، وستحصل على إجابة مفيدة من المرة الأولى.


التداول ينطوي على مخاطر. الأداء السابق لا يضمن النتائج المستقبلية.

الملخص

ملخص الذكاء الاصطناعي
Reverse RSI Phantom is a trading indicator that reinterprets the traditional Relative Strength Index (RSI) by projecting RSI overbought and oversold levels directly onto the price chart as dynamic bands. Instead of displaying RSI in a separate pane, it calculates the price levels that correspond to RSI values of 70 and 30 and draws these as smoothed bands on the price scale, allowing traders to visually assess overbought and oversold pressure in context with price action.

Key features include:
- Two price bands representing RSI thresholds with gradient fills indicating pressure intensity.
- A midline and candle tinting reflecting the current trend regime.
- Confluence-scored BUY and SELL signals displayed on signal bars with a score out of five.
- A comprehensive trade plan per signal, showing entry, an ATR-based stop loss, and three customizable profit targets.
- Visual markers for trend regime changes and RSI-price divergences.
- An 18-row informational panel summarizing regime, ATR, RSI states, volume, confluence, active trades, and historical performance.
- Configurable settings covering RSI parameters, smoothing, trend filters, confluence thresholds, stop modes, risk targets, divergence lookback, and alert/webhook options.

The indicator operates as an overlay on any instrument and timeframe, requiring volume data for full functionality. Alerts and webhooks can notify users of key events such as signals, trend shifts, targets, and stops. Non-repaint mode ensures signals are fixed once bars close. It is designed for traders who use RSI and seek integrated signals with trade management guidance.
ملف تعريف المؤشر
فئة المؤشر
الزخم
نوع المخرجات
التصور
الإشارات
متطلبات البيانات
الحجم
الإشارات المدعومة
الانعكاس
التباين
لمس المستوى
كسر المستوى
قوة الاتجاه

تقييمات العملاء

5.0
التقييمات: 1
5
100 %
4
0 %
3
0 %
2
0 %
1
0 %
تقييمات العملاء
September 20, 2026
Intersting settings, configurative, bands act like bollinger on the exterior, while showing accurate signals for buy/sell in the OB/OS area (your choice). These new style indicators showcase coding expertise. You just simply have more options to ustilize than in most RSI indicators. ,Aswell, tlhe colorng is very rich, many tweaks can be made; no way to miss your entries with this one. Good job sir; thanks for support & professioanlism (others could definitely take a lesson from you).

مناقشة

الأسئلة الشائعة

Supertrend
Key Levels
RSI
Volume
ATR
Support & Resistance
يتم توفير المنتجات المتاحة من خلال cTrader Store، بما في ذلك روبوتات التداول والمؤشرات والإضافات، من قبل مطوري الطرف الثالث وإتاحتها لأغراض الوصول المعلوماتي والفني فقط. cTrader Store ليس وسيطًا ولا يقدم نصائح استثمارية أو توصيات شخصية أو أي ضمان للأداء المستقبلي.

المزيد من هذا المؤلف

مؤشر
ATR
CCI
+4
A trend line that never steps back, a shaded band to the price, and a pointer at the swing where the trend turns.
مؤشر
ATR
RSI
+4
Adaptive Ichimoku with nine-factor confluence scoring, five signal types, smart TP/SL and an MTF panel.
مؤشر
ATR
RSI
+5
Fusion trend line with a layered cloud, BULL and BEAR labels, scored re-entry triangles and exit markers.
مؤشر
ADX
ATR
+5
EMA-cross signals scored on six confluence layers, with an ATR stop, three targets and a live panel
مؤشر
ATR
EMA
+3
EMA cross filtered by a trend average and its ATR channel, with long, short and close marks and colored candles.
مؤشر
ATR
Volume
+3
Fibonacci trend signals on closed bars, with an ATR stop, up to four targets and a break-even ladder.
شعار "Bullion Horizon"
إحصائيات مباشرة
$97
/
$147
cBot
Balanced
Fixed Lot
+5
Gold grid cBot for XAUUSD H1: four-signal confluence on closed bars, ladders closed at a basket profit, news filter
15.6%
العائد على الاستثمار
2.33
عامل الربح
مؤشر
ADX
ATR
+5
Ten confluence layers scored on every closed bar, with an anti-chop gate, pivot levels and a live dashboard.
مؤشر
ADX
ATR
+5
SuperTrend signals scored on five confluence factors, with an ATR stop, three targets and a dashboard.
مؤشر
ATR
EMA
+4
Range-filter BUY/SELL signals scored by four confluence layers, with a stop, five targets and a trend panel
شعار "Blaze Synchro"
إحصائيات مباشرة
$97
/
$147
cBot
ATR
RSI
+5
Buy-only gold grid cBot for XAUUSD M5: RSI extremes on the forming bar, two-step ladder, basket equity stop
4
عامل الربح
شعار "AuricFlow"
إحصائيات مباشرة
$97
/
$147
cBot
RSI
SL Manager
+5
Gold breakout cBot with a prop-firm guard: pick your firm, phase and size; risk and limits come from the firm's rules
2
عامل الربح

قد يعجبك أيضًا

مؤشر
Pin Bar
Inducement
+5
Institutional Nasdaq Session Liquidity Map with Live Point HUD, Sweep Alerts & Interactive Playbook.
شعار "OR Session Zones"
الأعلى تقييمًا
4.2
(5)
$25
/
$45
مؤشر
Forex
EURUSD
+7
A high‑precision Opening Range indicator that detects session opens (NY, London, EU, Tokyo, Shanghai)
مؤشر
RSI
MACD
+7
The ZigZag indicator is a technical analysis tool primarily used to identify key price reversal points.
مؤشر
Volume
Imbalance
+1
Volume profile indicator that auto-detects the latest trendline. Shows POC, Value Area (VAH/VAL), and High Volume Nodes
مؤشر
Forex
Indices
+1
Professional Fair Value Gaps with multitimeframe spot on
مؤشر
ATR
EMA
+3
The UTBot you know from TradingView — now on cTrader with confirmed signals, VWAP, EMA and session overlays.
مؤشر
ATR
SMC
+18
Precision SMC tool with HTF sweeps, MSS confirmation & smart FVG detection for high-probability reversals.
مؤشر
ADX
ATR
+5
SuperTrend signals scored on five confluence factors, with an ATR stop, three targets and a dashboard.
مؤشر
The Break of Structure (BoSCHoCh) Indicator is a smart market structure tool designed to help traders easily spot trend.
مؤشر
ATR
Volume
+3
Fibonacci trend signals on closed bars, with an ATR stop, up to four targets and a break-even ladder.
مؤشر
ATR
EMA
+3
EMA trend, RSI reclaim and divergence signals with ATR stop and two targets, swing levels and a 16-row dashboard.
مؤشر
RSI
MACD
+1
Precision Supply & Demand zones indicator—automatically plots key buy/sell areas on your chart for smarter entries.
مؤشر
Market Structure
Stop guessing which trading session you in, with Sessions indicator sessions are in your finger tips like a pro
مؤشر
CHOCH
Inducement
+5
TradeLens - Frame the Trade. Refine the Entry. Two Timeframes. One Decision.
مؤشر
ATR
EMA
+4
The FULL-MARKET-VIEW-DASHBOARD is a professional-grade trading suite for cTrader that eliminates market noise.
مؤشر
Displays the previous day's, last week's, and last month's highest and lowest price levels on your chart.
شعار "MARainbow"
الأعلى تقييمًا
4.2
(4)
$19
/
$38
مؤشر
Forex
Crypto
+3
MARainbow gives you the edge with four customizable moving averages—each color-coded for instant recognition.
مؤشر
Forex
Real-Time Candlestick Pattern Detection with Custom Alerts & Trend Analysis for cTrader

السعر

8
المبيعات
167
التثبيتات المجانية