present
Zarejestruj się i otrzymaj 50 $ zniżki na pierwszy zakup
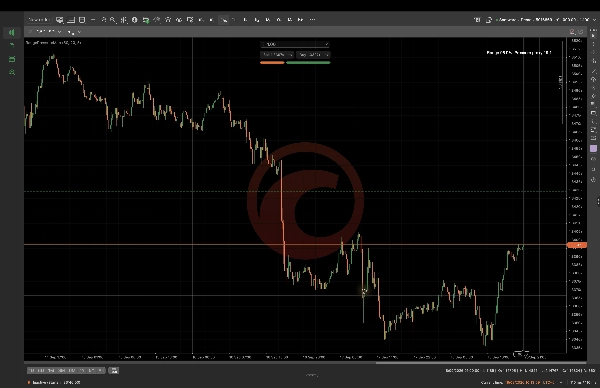
Trading product for Range Pressure Map Wskaźnik EMA Volume, image 1
Range Pressure Map
Wskaźnik
Wersja 1.0, Sep 2026
Windows, Mac
5.0
Opinie: 2
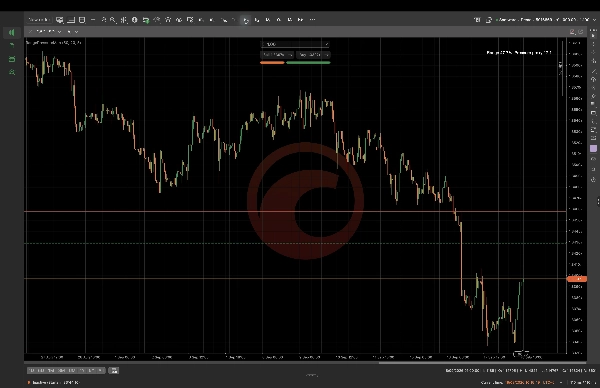
Trading product for Range Pressure Map Wskaźnik EMA Volume, image 2
Trading product for Range Pressure Map Wskaźnik EMA Volume, image 3
Trading product for Range Pressure Map Wskaźnik EMA Volume, image 4
Trading product for Range Pressure Map Wskaźnik EMA Volume, image 5
Od 16/09/2026

Opis

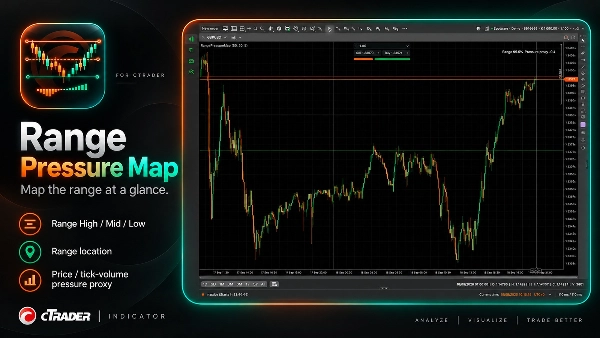
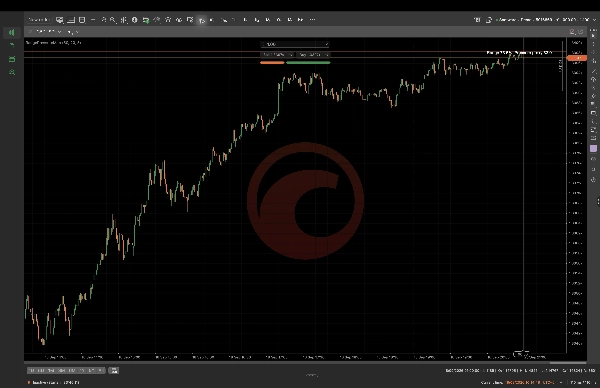
Mapa ciśnienia zakresu oblicza zakres retrospektywny i wyświetla Range High, Range Mid oraz Range Low wraz z aktualną lokalizacją ceny oraz deterministycznym wskaźnikiem ciśnienia wolumenu ticków. Skonfiguruj zakres retrospektywny, zakres ciśnienia oraz długość EMA, aby dopasować je do kontekstu wykresu, który analizujesz. Jest zaprojektowany do dyskrecjonalnej analizy wykresów i nie reprezentuje przepływu zleceń, rzeczywistego wolumenu rynku, aktywności kupujących lub sprzedających, prognoz ani automatycznego wykonywania transakcji. Wartości zależą od wybranego symbolu, interwału czasowego, parametrów i dostępnych danych.

Podsumowanie

Podsumowanie AI
Range Pressure Map is a cTrader indicator that calculates a lookback range and visually displays the Range High, Range Mid, and Range Low levels on your chart. It also shows the current price location within this range alongside a deterministic tick-volume pressure proxy, which serves as an estimate of market pressure based on tick volume data. Users can customize parameters including range lookback period, pressure lookback, and EMA length to align with their specific chart context. This tool is intended for discretionary chart analysis and does not provide order flow data, real market volume, buyer or seller activity, predictive signals, or automated trade execution. Its outputs depend on the selected trading symbol, timeframe, and input parameters. The indicator supports visualization of support and resistance levels combined with volume-based pressure insights to assist traders in analyzing price action within defined ranges.
Profil wskaźnika
Kategoria wskaźnika
Wsparcie i opór
Typ wyjścia
Wizualizacja
Wymagania dotyczące danych
Tylko słupki

Dyskusja

Opinie klientów

5.0
Opinie: 2
5
100 %
4
0 %
3
0 %
2
0 %
1
0 %
Opinie klientów
October 20, 2026
Range Pressure Map provided a clean and consistent range view on EURUSD and XAUUSD across H1 and M1. High, Mid and Low levels were clearly plotted, while the displayed range percentage matched the visible price location well. The pressure proxy added context without cluttering the chart or being presented as true order flow. Score 4,7/5
October 7, 2026
A range high, midpoint and low put the pressure proxy in a clear setting. Lookback and EMA controls make the view adjustable, and the description is upfront about using tick volume rather than real buyer and seller flow. That honesty makes the map easier to interpret.

Częste pytania

EMA
Volume
Produkty dostępne za pośrednictwem cTrader Store, w tym boty handlowe, wskaźniki i wtyczki, dostarczane są przez deweloperów zewnętrznych i udostępniane wyłącznie w celach informacyjnych oraz w celu zapewnienia dostępu technicznego. cTrader Store nie jest brokerem i nie zapewnia doradztwa inwestycyjnego, nie udziela spersonalizowanych rekomendacji ani nie gwarantuje przyszłych wyników.
Więcej od tego autora

Logo „BOS CHOCH Structure”
Najwyżej oceniane
4.5
(4)
$29
/
$39
Wskaźnik
BOS
MSS
+4
See confirmed BOS, CHOCH and SWEEP structure events on your cTrader chart.
Wskaźnik
BOS
Add standard-timeframe context candles to a native Renko chart.
Wskaźnik
Channel
Key Levels
+1
Monitor a selected chart trendline and confirm breaks on candle close.
Wtyczka desktopowa
Trade Journal
Trade Statistics
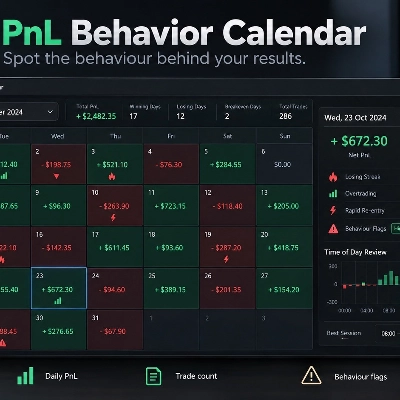
Review daily PnL, trade counts, losing streaks and rapid re-entry from your cTrader history.
Wtyczka desktopowa
Chart UI Tools
Keep lines, zones and channels synced across selected same-symbol charts from one desktop plugin.
cBot
Drawdown Guard
Daily Loss Limit
Monitor account-wide loss and stop-loss risk budgets, with optional order cancellation and post-fill closure.
Wtyczka desktopowa
Position Sizer
Risk Calculator
Size manual trades from your risk settings and review Market, Limit or Stop orders before execution.
Wskaźnik
Volume
Key Levels
View tick activity across a selected chart range with Point of Control, Value Area High and Value Area Low.

Możesz także polubić

Wskaźnik
Doji
Wedge
+5
Angora Pattern Recognition is a cTrader indicator that finds, draws and tracks classic chart patterns automatically.
Logo „Cross EMA Pro”
Najwyżej oceniane
4.4
(5)
$49
Wskaźnik
Forex
BTCUSD
+5
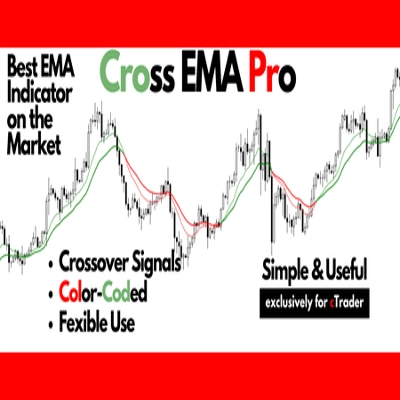
Cross EMA Pro – Trend Reversal Indicator
Wskaźnik
BOS
Volume
+5
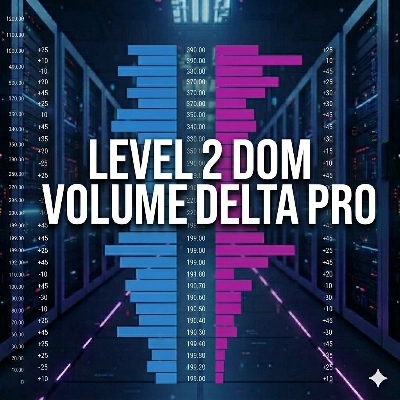
The Volume Delta Indicator using Institutional Level 2 DOM Data, The Edge Institutions Pay Millions For, now on cTrader
Wskaźnik
Volume
Key Levels
+1
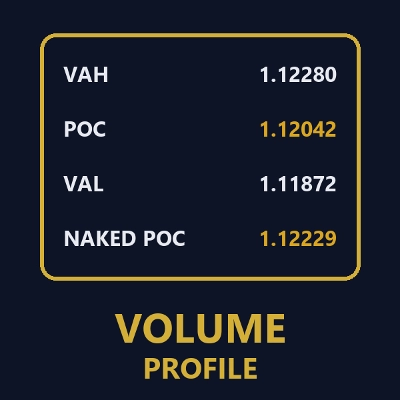
Session volume profiles from tick volume: POC, value area high and low, and naked POCs extended until touched.
Logo „Major Tops and Bottoms”
Najwyżej oceniane
4.2
(4)
$29
Wskaźnik
Signal
Scalping
Average accuracy of around 60% to 70% on 45min timeframes it is highly recommended to use stop losses
Wskaźnik
Drawdown Monitor
Proprietary trading desk risk monitoring dashboard!
Wskaźnik
Prop
VWAP
+15
VWAP with standard deviation bands. Fully customizable colors, periods, and multipliers for precise trading signals
Wskaźnik
Prop
Forex
+11
Customize your Moving Average! Choose any timeframe and price source for precision and flexibility in your analysis.
Wskaźnik
AI
SMC
+7
The ultimate tool for Price Action and ICT. High, Low and Mid levels for days, weeks Inc. NY Midnight and Custom Range.
Wskaźnik
Forex
Crypto
+2
HTF Candle
Wskaźnik
Drawdown Monitor
Protect your funded account. Real-time Daily Equity Drawdown monitor with Green / Orange / Red flashing alerts.
Wskaźnik
Fibonacci
Key Levels
+1
Explore Elliott wave counts, three swing sizes and example levels with an interactive cTrader chart panel.
Wskaźnik
Prop
Forex
+5
Half Trend – Trend Reversal Indicator for cTrader
Wskaźnik
Imbalance
Key Levels
+2
A Next-Generation Adaptive Oscillator with Z-Score Regime Engine.
Wskaźnik
Forex
BTCUSD
+11
Master trends with Smart ADX: MTF Scanner, precise Buy/Sell signals, Divergence & clear Exit targets 🎯
Wskaźnik
Forex
Identify 34 candlestick patterns, track trends across timeframes, and get instant alerts with this powerful trading tool
Wskaźnik
AI
Prop
+14
Professional Trading Indicator Transform Your Trading with Intelligent Signal Detection RenkoProfit
Wskaźnik
Volume
Key Levels
Dynamic Visible Range Volume Profile for cTrader. Real-time POC, Value Area & Smart Alerts for precise trading.

Cena

Od 16/09/2026