الوصف
Strong Supertrend Turn Market Movement into a Clear Map
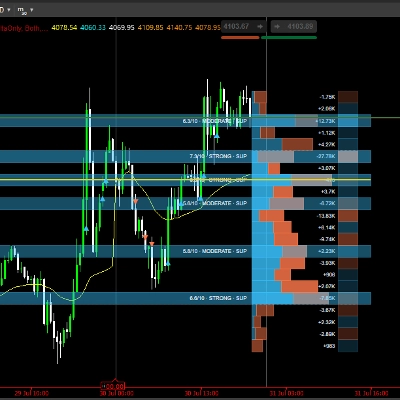
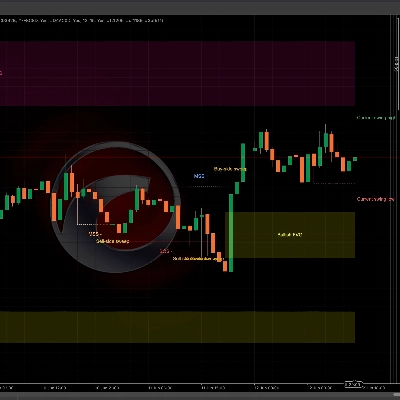
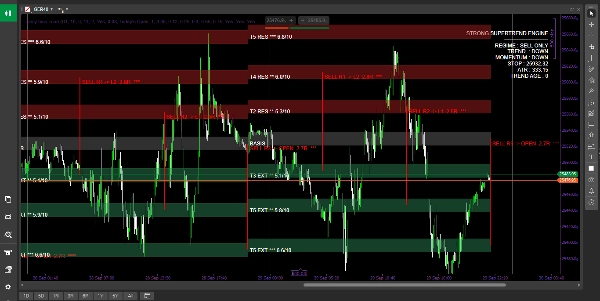
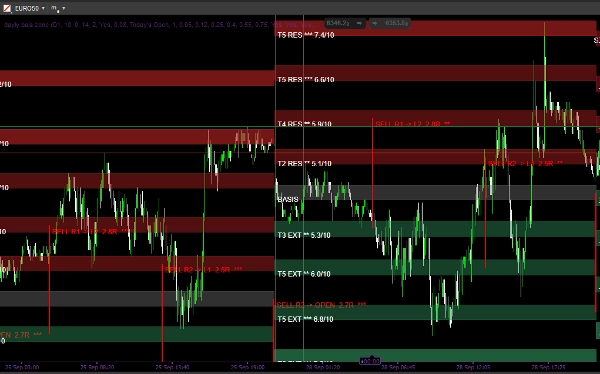
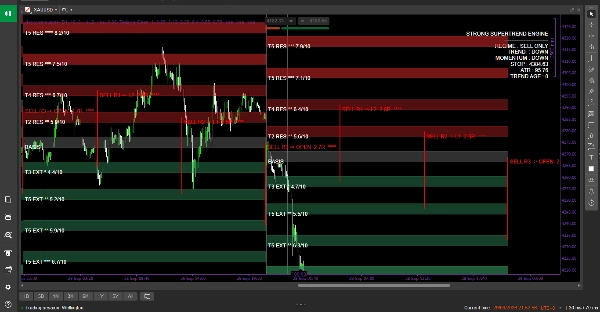
Market analysis is no longer just about searching for a buy or sell signal. The Strong Supertrend Engine is designed to give you a broader view of the market by transforming trend, volatility, momentum, and price zones into an easy-to-read dynamic map. The indicator relies on the Supertrend, ATR, and Basis to build a clear market structure, then identifies multiple levels around the price and evaluates the strength of each zone with a score from 0 to 10 to help you identify the areas worth watching. Through Laguerre Momentum analysis and a custom Dashboard interface, you can see the trend, momentum status, and market level at a glance, alongside potential continuation scenarios and risk-to-reward ratios. The indicator is not merely a tool that gives you an arrow on a chart; rather, it is a comprehensive analysis system that translates complex price action into an organized map, helping you understand where the market is moving, what the key zones are, and when you need further confirmation before making a decision.
How to Use: Start by reading the Dashboard to determine the overall market condition, trend, and momentum. Then, use the Basis as a reference point to understand the price position, while monitoring the five zone layers above and below it, paying closer attention to higher-rated zones. Use the Supertrend zone as an additional reference for the trend and for support or resistance, and watch how the price interacts with the specified zones instead of entering blindly the moment price reaches them. Afterward, a smaller timeframe can be used to confirm price action and determine the entry point, stop loss, and target. Meanwhile, the Continuation scenarios displayed by the indicator serve as potential visualizations of continuing movement rather than automated trading orders. In this way, the indicator functions as a decision-making map: it defines the context and critical zones first, leaving the trader responsible for entry confirmation and risk management.
الملخص
Users start by interpreting the Dashboard to gauge overall market conditions, then use the Basis as a price reference point while monitoring five zone layers above and below it, focusing on higher-rated zones. The Supertrend zone serves as an additional trend and support/resistance reference. Price interactions with these zones guide decision-making rather than triggering automatic entries. Traders can confirm entries, stop losses, and targets using smaller timeframes. Continuation scenarios provide visual forecasts of possible market moves without automated orders. This indicator functions as a decision-making tool that organizes complex price action into an accessible format, supporting informed trading decisions. It supports visualization outputs and signals including trend strength, volatility regime, level breaks, and level touches, relying on bar and volume data inputs.