
الوصف
المتوسط المتحرك المرجح الكمومي (QWMA)
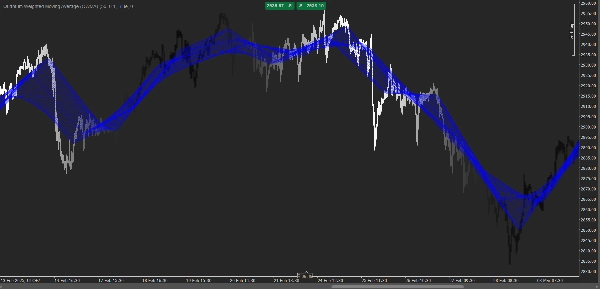
الالمتوسط المتحرك المرجح الكمومي (QWMA) هو مؤشر تداول متقدم مصمم لضبط وزن الأسعار السابقة ديناميكيًا بناءً على ظروف السوق. على عكس المتوسطات المتحركة التقليدية التي تطبق أوزانًا ثابتة، يستخدم QWMA دالة تلاشي أُسية تكيفية لإعطاء أهمية أكبر لتحركات الأسعار الأخيرة مع الأخذ في الاعتبار البيانات التاريخية.
الميزات الرئيسية:
✅ الوزن التكيفي: يضبط تأثير الأسعار السابقة بناءً على التقلب وقوة الاتجاه.
✅ حساسية محسنة: يستجيب بسرعة أكبر لتغيرات الأسعار مقارنة بالمتوسطات المتحركة البسيطة والأُسية.
✅ تقليل الضوضاء: يساعد في تصفية ضوضاء السوق مع الحفاظ على وضوح الاتجاه.
✅ معلمات قابلة للتخصيص: يسمح للمتداولين بتعديل عوامل التلاشي ودوال الوزن لتناسب استراتيجيات تداول مختلفة.
كيف يعمل:
يطبق QWMA دالة تلاشي أُسية على بيانات الأسعار السابقة، مما يضمن أن الأسعار الأقدم لها تأثير متناقص بينما تساهم القيم الحديثة بشكل أكبر. ينتج عن ذلك خط اتجاه أكثر سلاسة وأكثر استجابة يتكيف مع ديناميكيات السوق المتغيرة.
مثالي لـ:
📈 متتبعي الاتجاه – تحديد الاتجاهات القوية مع تأخير ضئيل.
📉 متداولي التأرجح – اكتشاف انعكاسات السوق مبكرًا مقارنة بالمتوسطات المتحركة القياسية.
💹 المتداولين السريعين – الحصول على رؤى سريعة حول تحولات الزخم قصيرة الأجل.
QWMA هو أداة قوية للمتداولين الذين يبحثون عن توازن بين النعومة والاستجابة، مما يجعله مناسبًا لمختلف الأسواق المالية، بما في ذلك الأسهم، الفوركس، وتداول العملات الرقمية. 🚀
الملخص
تقييمات العملاء
5 | 0 % | |
4 | 100 % | |
3 | 0 % | |
2 | 0 % | |
1 | 0 % |


![شعار "Wyckoff Toolkit [Iridio Capital]"](https://cdn.ctrader.com/image/webp/8acfe6a1-6a8e-4578-9367-9df3af2b1801_27763)


