
50 percent
Indikator
Version 1.0, Aug 2025
Windows, Mac
5.0
Bewertungen: 2

Beschreibung
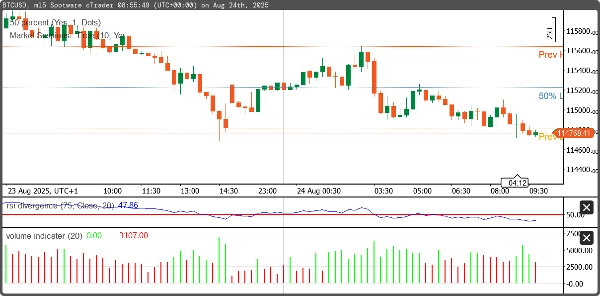
Dieser cBot erkennt automatisch die Hoch- und Tiefpreise der vorherigen Sitzung und berechnet den Mittelpunkt zwischen ihnen. Er ist darauf ausgelegt, Trader zu unterstützen, indem er wichtige Unterstützungs-/Widerstandszonen und Marktgleichgewichtsniveaus identifiziert, die häufig für Umkehr- oder Ausbruchsstrategien verwendet werden.
- Erkennt das Hoch und Tief des vorherigen Tages (oder der Sitzung).
- Berechnet den Mittelpunkt zwischen Hoch und Tief.
- Zeichnet die Hoch-, Tief- und Mittelpunktsniveaus im Chart ein.
Zusammenfassung
Indikatorprofil
Kundenbewertungen
5.0
Bewertungen: 2
5 | 100 % | |
4 | 0 % | |
3 | 0 % | |
2 | 0 % | |
1 | 0 % |
Kundenbewertungen
August 29, 2025
The screen feels less crowded, but the final call still needs say no.
August 20, 2025
Diskussion
Häufig gestellte Fragen (FAQ)
Über den cTrader Store verfügbare Produkte, einschließlich Handelsbots, Indikatoren und Plugins, werden von externen Entwicklern bereitgestellt und nur zu Informations- und technischen Zugriffszwecken verfügbar gemacht. cTrader Store ist kein Broker und erbringt keine Anlageberatung, persönlichen Empfehlungen oder eine Garantie für zukünftige Performance.
Mehr von diesem Autor


Preis
Seit 14/05/2025
10.1M
Gehandeltes Volumen
81.44K
Pip-Gewinn
205
Kostenlose Installationen