
Beschreibung
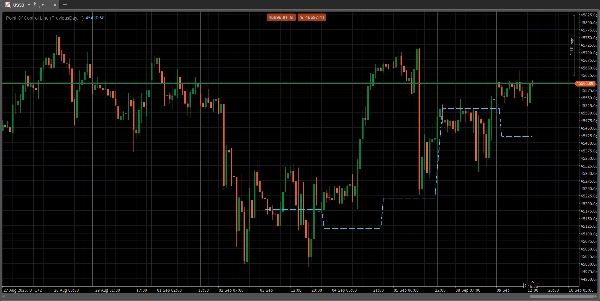
Der Point of Control (POC) ist ein Kursniveau in einem Volumenprofil-Chart, an dem innerhalb eines bestimmten Zeitraums das höchste Handelsvolumen stattgefunden hat. Dieses Niveau fungiert als bedeutende Unterstützungs- oder Widerstandszone, da es einen Preis darstellt, bei dem große Handelsinstitutionen am aktivsten waren und an dem der Marktpreis einen Konsens fand. Trader nutzen den POC, um wichtige Kurszonen zu identifizieren, die Marktstimmung einzuschätzen und potenzielle Kursbewegungen sowie Umkehrungen vorherzusehen.
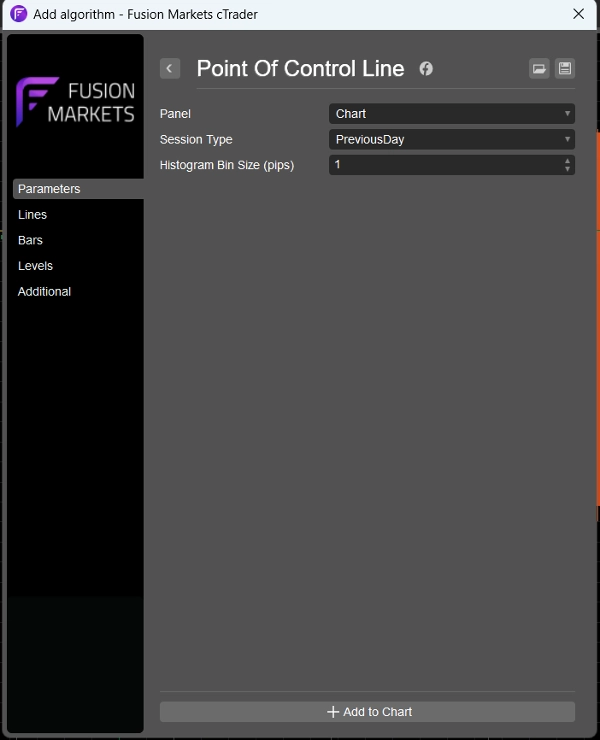
Ich habe sämtliches Rauschen aus den üblichen Volumenprofil-Indikatoren entfernt und nur die POC-Linie für diejenigen belassen, die nur die Linie benötigen. Ich habe einen Parameter hinzugefügt, um die POC-Linie entweder für den vorherigen Tag, das 4-Stunden- oder das 1-Stunden-Volumenprofil anzuzeigen, sodass sie für Trader unterschiedlicher Zeitrahmen geeignet ist.
Zusammenfassung
Kundenbewertungen
5 | 100 % | |
4 | 0 % | |
3 | 0 % | |
2 | 0 % | |
1 | 0 % |


