
Açıklama
Ultimate RSI (Göreceli Güç Endeksi)
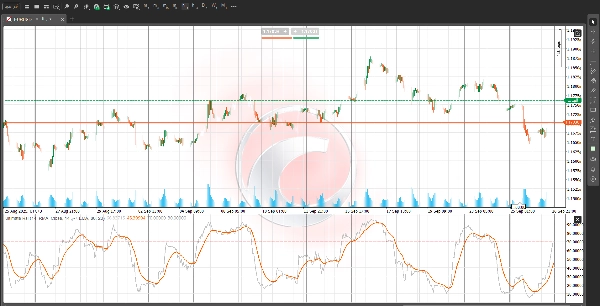
Ultimate RSI, piyasa momentumu ve trend gücünün daha düzgün, temiz ve daha duyarlı bir okumasını sağlamak için tasarlanmış gelişmiş ve özelleştirilmiş bir osilatördür. Geleneksel Göreceli Güç Endeksi'ne (RSI) kıyasla önemli bir yükseltme temsil eder, piyasa gürültüsünü filtrelemeye ve yanlış sinyalleri (whipsaw) en aza indirmeye odaklanır. Bu, trendleri doğrulamak ve güvenilir dönüş noktalarını belirlemek için paha biçilmez bir araç yapar.
Ana Özellikler ve Geliştirmeler:
- Geliştirilmiş Momentum Hesaplaması: Gösterge, fiyat değişimini hesaplamak için sofistike bir yöntem kullanır. Sadece günlük fiyat hareketlerine dayanmak yerine, momentum sinyali, fiyat geri dönük dönemde yeni bir yüksek veya yeni bir düşük kaydettiğinde önemli ölçüde güçlendirilir. Bu süreç, göstergenin gerçek kırılmalara güçlü tepki vermesini sağlarken, küçük ve dalgalı hareketleri görmezden gelmesini sağlar.
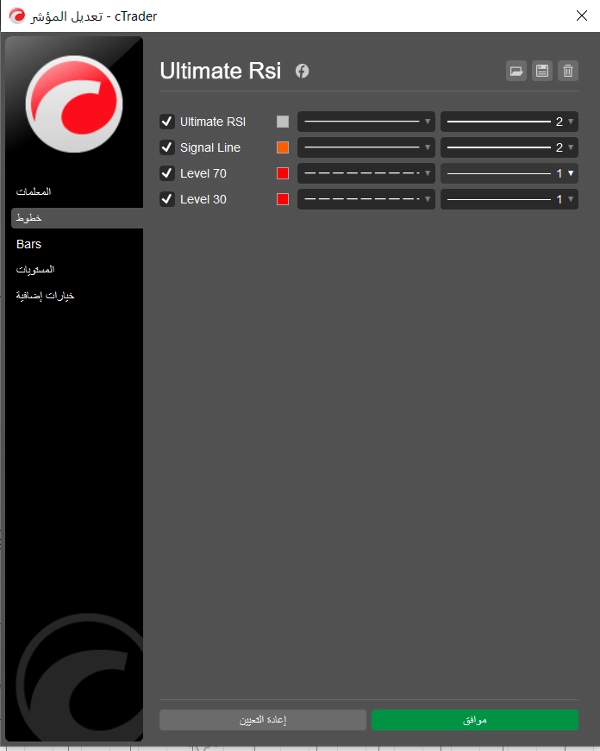
- Özel Sinyal Hattı: RSI'nin kendisinin hareketli ortalaması olan ayrı bir Sinyal Hattı içerir ve bu hat bağımsız olarak yapılandırılabilir. Ultimate RSI hattı ile Sinyal Hattı arasındaki kesişmeler, özellikle aşırı alım/aşırı satım seviyelerine yakın yerlerde, giriş veya çıkışlar için daha net ve yüksek güvenilirlikte tetikleyiciler olarak sıklıkla kullanılır.
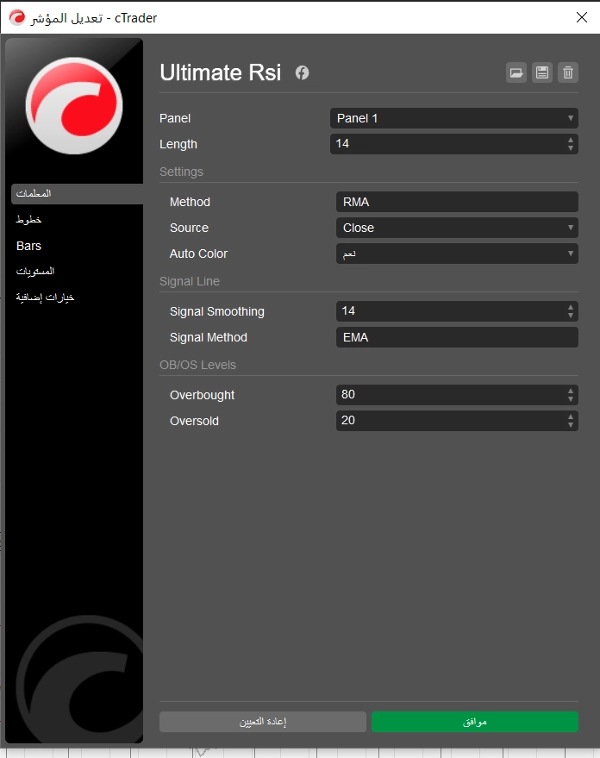
- Esnek Düzleştirme Yöntemleri: Kullanıcılar, hem RSI hesaplaması hem de Sinyal Hattı için yaygın seçeneklerden düzleştirme türünü seçme esnekliğine sahiptir: EMA (Üssel Hareketli Ortalama), SMA (Basit Hareketli Ortalama), RMA (Wilder'ın Hareketli Ortalaması) ve TMA (Üçgen Hareketli Ortalama). Bu, göstergenin hassasiyetinin hassas şekilde özelleştirilmesine olanak tanır.
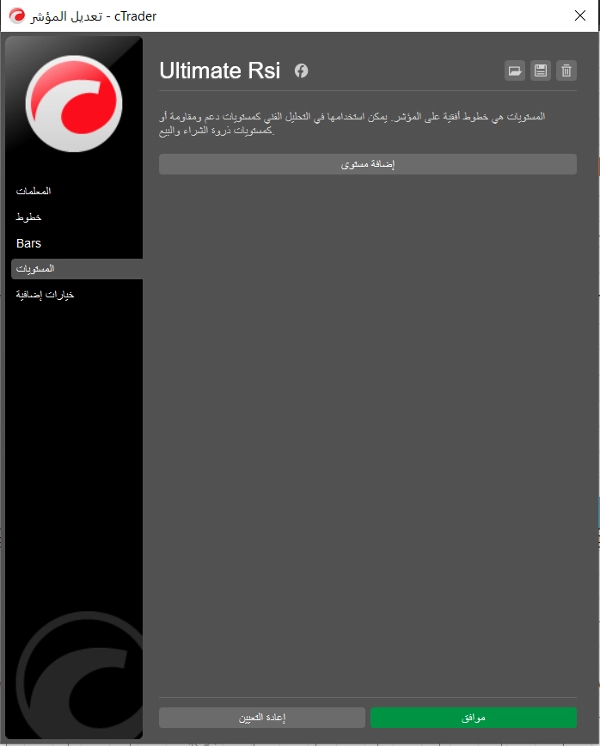
- Görsel AŞ/AS Bölgeleri: Varsayılan aşırı alım (AŞ) seviyesi olan 80 ve aşırı satım (AS) seviyesi olan 20 arka plan gölgelendirmesi ile net bir şekilde işaretlenmiştir. Güçlü trend piyasalarında, bu bölgelerdeki sürekli okumalar genellikle anlık bir dönüşten ziyade olağanüstü trend gücünü gösterir ve trend takip stratejileri için güçlü bir doğrulama aracı sunar.
Ultimate RSI ile Nasıl İşlem Yapılır:
- Trend Doğrulama: Momentum merkezi olarak 50 seviyesi kullanılır. 50'nin üzerinde sürekli bir okuma yükseliş eğilimini doğrularken, 50'nin altındaki bir okuma düşüş eğilimini doğrular.
- Giriş Sinyalleri: Potansiyel uzun pozisyon girişi için Ultimate RSI hattının Sinyal Hattının üzerinden geçmesini, potansiyel kısa pozisyon girişi için ise Sinyal Hattının altından geçmesini arayın; bu kesişmelerin 50 seviyesiyle olan konumuna özellikle dikkat edin.
- Gürültü Azaltma: Gerçek aralık genişlemesini vurgulayarak ve gelişmiş düzleştirme kullanarak, Ultimate RSI, konsolidasyon dönemlerinde erken giriş veya çıkışları önleyerek traderların odaklanmasını sağlar.
Feragatname: Bu açıklama yalnızca bilgilendirme ve eğitim amaçlıdır. Ticaret risk içerir ve tüm gösterge okumaları, herhangi bir ticaret kararı için kapsamlı fiyat hareketi analizi ile birleştirilmelidir.


