
Beschreibung
Elliott-Welle-3-Fortsetzung & Elliott-Umkehrungen
Elliott-Wellen-Struktur ist ein Indikator, der entwickelt wurde, um die Marktstruktur mit der Elliott-Wellen-Theorie zu analysieren.
Er kombiniert bestätigte Swing-Analyse, Marktstruktur, Elliott-Impuls-Erkennung und eine spezielle Wave-2-zu-Wave-3-Fortsetzung.
Dieses Tool wurde für Trader entwickelt, die Klarheit, Bestätigung und regelbasierte Ausführung benötigen, nicht subjektives Zeichnen.
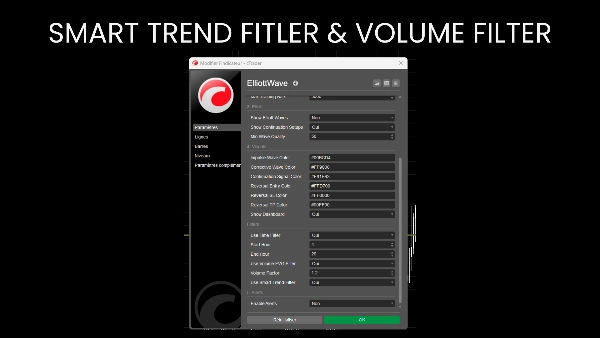
Nicht-neuzeichnende Swing-Engine
Alle Berechnungen basieren auf bestätigten Swing-Punkten unter Verwendung von:
- Einstellbarer Swing-Tiefe
- Minimaler Preisabweichung (Pip-Filter)
- Bestätigungs-Bars
Sobald ein Swing angezeigt wird, bewegt er sich nie, was volle historische Zuverlässigkeit gewährleistet.
Marktstruktur-Analyse:
Identifiziert und kennzeichnet automatisch:
- Höheres Hoch (HH)
- Höheres Tief (HL)
- Niedrigeres Hoch (LH)
- Niedrigeres Tief (LL)
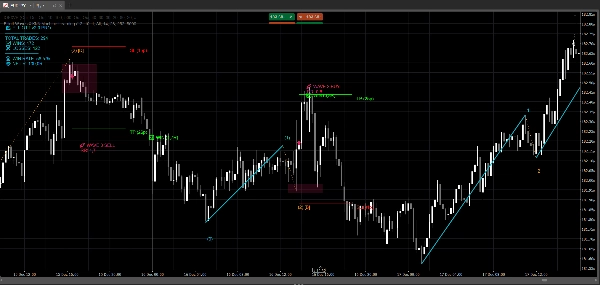
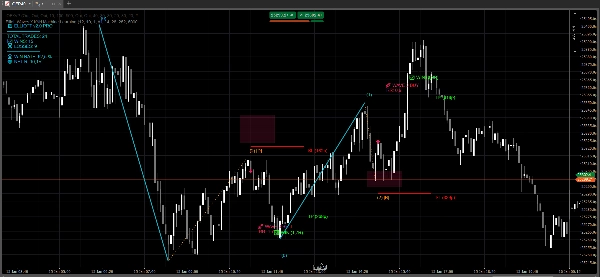
Elliott-Wellen-Impuls-Erkennung:
Der Indikator erkennt automatisch vollständige 5-Wellen-Elliott-Impulse in beide Richtungen:
- Bullisch: T-H-T-H-T-H
- Bärisch: H-T-H-T-H-T
Er validiert Impulse anhand interner Regeln:
- Stärke der Welle 3
- Retracement-Logik von Welle 2 und Welle 4
- Proportionalität der Welle 5
Jeder Impuls wird mit einem Qualitätswert (0–100) bewertet und direkt im Chart beschriftet.
Wave-3-Fortsetzungs-Setup (Primäres Handelsmodul)
Dies ist die Kern-Handelskomponente des Indikators.
Das System identifiziert Wave 0-1-2 Fortsetzungsstrukturen und bereitet Einstiege für Wave 3 vor:
- Bullisch: Tief → Hoch → Höheres Tief
- Bärisch: Hoch → Tief → Niedrigeres Hoch
Validierungskriterien umfassen:
- Wellen 2 Retracement zwischen 23,6 % und 88,6 %
- Keine Ungültigmachung durch Welle 0
- Trend-Ausrichtung mittels Marktstruktur
- Stärke der Welle 1 relativ zum ATR
- Preis muss auf OB liegen
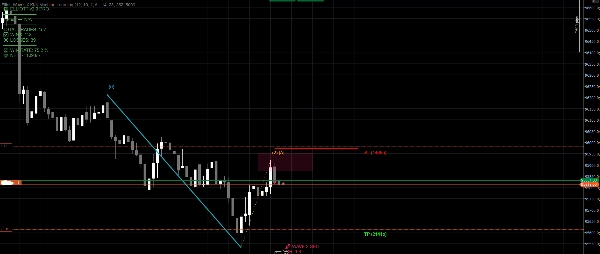
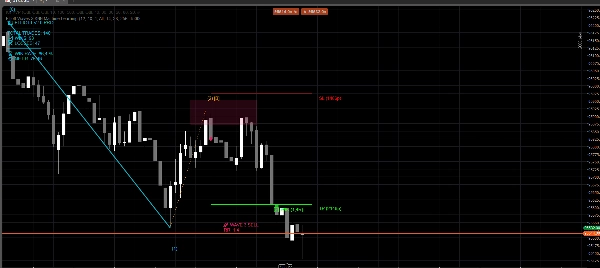
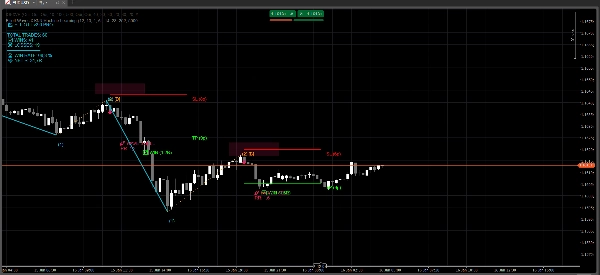
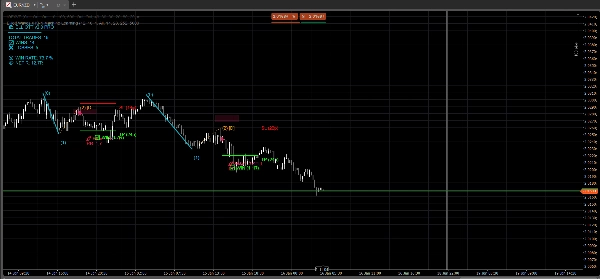
Nach Validierung zeichnet der Indikator automatisch:
- Wave 1 und Wave 2 Struktur
- OB-Einstiegszone
- Einstiegssignal
- Stop Loss basierend auf ATR jenseits von Wave 2
- Take Profit basierend auf ATR-Projektion
Risiko- & Handelsmanagement
- Stop Loss und Take Profit werden dynamisch unter Verwendung von ATR berechnet
- Das Risiko-Ertrags-Verhältnis wird direkt im Chart angezeigt
- Entwickelt, um überdehnte oder qualitativ schlechte Setups zu vermeiden
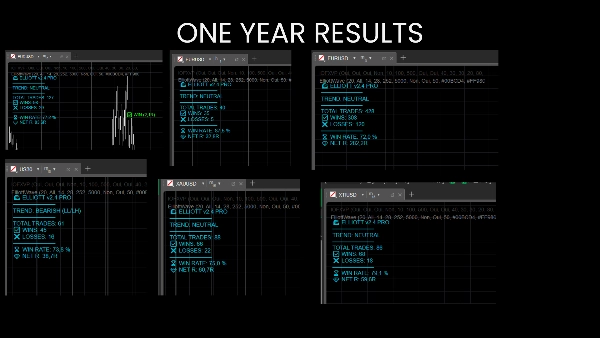
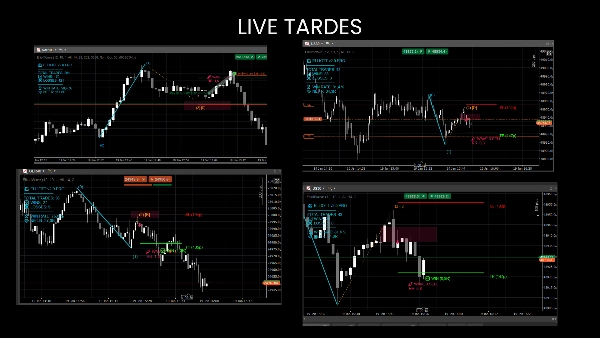
Ich persönlich nutze es für das Scalping von Indizes auf M1 & M5, aber es funktioniert auch mit FX, Rohstoffen, Aktien usw. ... Das Dashboard zeigt an, ob es bei einem bestimmten Asset profitabel war.
Die kostenlose Version erlaubt es, es auf großen FX M15 zu testen.


