Beschreibung
WAS ES TUT
Liquiditätsbasierte Unterstützung & Widerstand identifiziert, wo der Preis tatsächlich umgekehrt ist – nicht nur, wo Linien gezogen werden können.
Es erkennt Wendepunkte in Ihrem Chart, ordnet sie psychologischen runden Zahlen zu und quantifiziert die Kauf-/Verkaufsaktivität in jeder Zone. Sie sehen, welche Levels bedeutende Liquiditätsaktivität zeigen und welche nur leere Linien sind.
Das Ergebnis ist Unterstützung und Widerstand mit Kontext – Bias, Volumenabsorption, Effizienz und umsetzbare Interpretation sind integriert.
WARUM ES WICHTIG IST
Traditionelle Methoden für Unterstützung und Widerstand haben eine gemeinsame Schwäche: Sie zeigen Ihnen wo der Preis war, sagen Ihnen aber nichts darüber, was dort passiert ist.
Ein Preislevel, das zweimal berührt wurde, und ein Level, das fünfzehnmal mit hohem Volumen getestet wurde, sehen auf einem Standard-SR-Indikator identisch aus. Aber sie verhalten sich sehr unterschiedlich, wenn der Preis zurückkehrt.
Das Problem
Linien an Wendepunkten zu zeichnen ist einfach. Zu verstehen, ob diese Levels halten, brechen oder Trader in eine Falle locken, erfordert eine tiefere Analyse, die die meisten SR-Tools nicht bieten:
- Wie viele Umkehrungen tatsächlich auf dem Level stattfanden?
- Haben Käufer oder Verkäufer dominiert?
- War die Ablehnung effizient oder erforderte sie massive Volumenabsorption?
- Sammelt das Level Energie für einen Ausbruch oder verteilt es vor einem Fehlschlag?
Die Lösung
Dieser Indikator misst die Liquiditäts-Signatur auf jedem Level – wie viele Umkehrungen stattfanden, wie tief sie gingen, wie viel Volumen beteiligt war und ob Käufer oder Verkäufer effizienter agierten.
Anstatt zu raten, welche Levels wichtig sind, sehen Sie genau, was der Markt in jeder Zone getan hat.
WIE ES FUNKTIONIERT
Adaptive Swing-Erkennung
Der Indikator verwendet eine regressionsbasierte Glättungsmethode, um Marktrauschen zu filtern und echte Wendepunkte zu identifizieren – Momente, in denen der Preis sich tatsächlich für eine Richtungsänderung entschied, nicht zufällige Dochte.
Drei Erkennungsmodi verfügbar:
- Major – Nur bestätigte, hochüberzeugte Umkehrungen
- Standard – Alle primären Swing-Strukturen
- Minor – Beinhaltet interne Swings für granulare Analyse
Rundzahl-Zonen-Mapping
Wendepunkte werden automatisch psychologischen Preislevels zugeordnet. Der Zonenabstand passt sich der Volatilität Ihres Instruments basierend auf der durchschnittlichen Swing-Tiefe an – keine manuelle Konfiguration erforderlich.
Setzen Sie den Multiplikator auf null, berechnet der Indikator den optimalen Abstand automatisch.
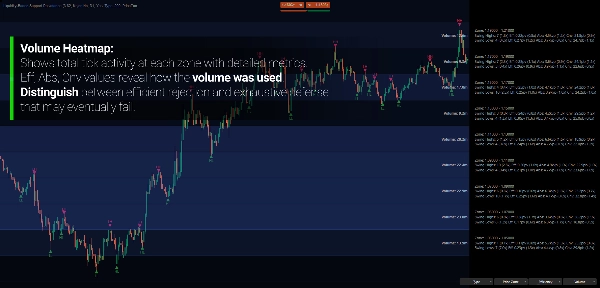
Liquiditätsmetriken
In jeder Zone berechnet der Indikator:
- Tiefe – Wie weit der Preis vom Wendepunkt gereist ist (in Pips)
- Volumen – Gesamte Tick-Aktivität während des Swings
- Effizienz – Preisbewegung pro Volumeneinheit (misst Ausführungseffizienz)
- Absorption – Volumen, das benötigt wird, um die Preisbewegung zu begrenzen (Anstrengung, das Level zu halten)
- Überzeugung – Preisbewegung pro Kerze (Momentum und Commitment)
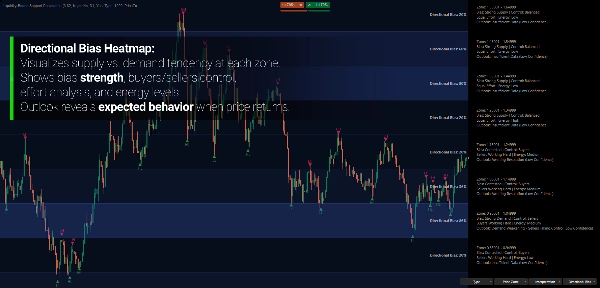
Richtungsanalyse
Jede Zone wird analysiert auf:
- Bias – Ist dies eine Angebotszone (mehr Swing-Hochs) oder eine Nachfragezone (mehr Swing-Tiefs)?
- Kontrolle – Agieren Käufer oder Verkäufer hier effizienter?
- Energie – Wie viel Gesamtaktivität im Vergleich zur Basislinie?
Diese Metriken werden kombiniert, um eine leicht verständliche Interpretation dessen zu liefern, was auf jedem Level passiert.
HAUPTMERKMALE
Mehrere Beschriftungsmodi
- Preis – Einfache Zonenidentifikation
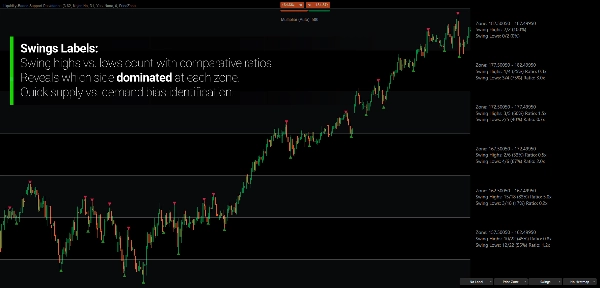
- Swings – Anzahl der Swing-Hochs vs. Tiefs mit Verhältnissen
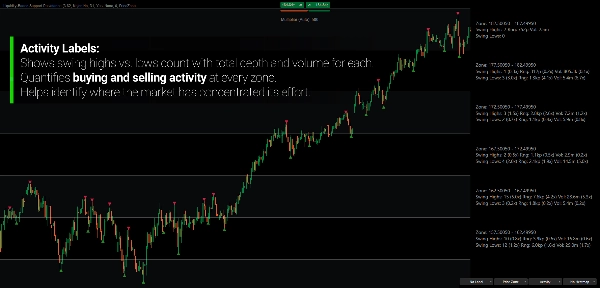
- Aktivität – Tiefe, Volumen und vergleichende Verhältnisse
- Effizienz – Berechnete Metriken, die institutionelle Präzision zeigen
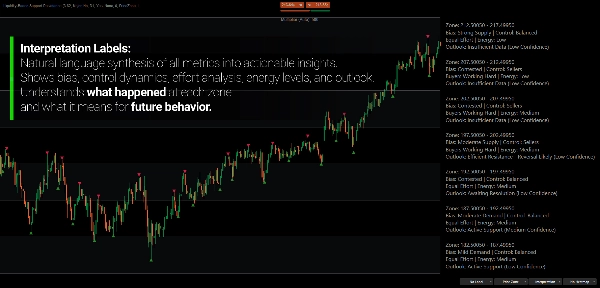
- Interpretation – Natürliche Sprach-Analyse von Bias, Kontrolle und Ausblick
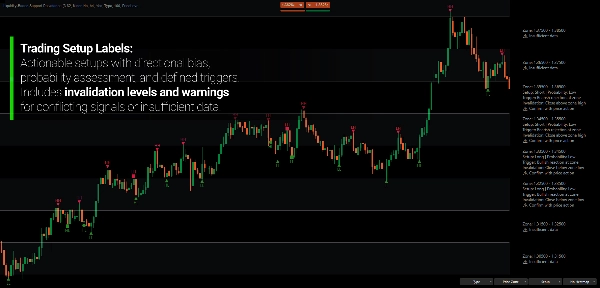
- Setup – Umsetzbares Trade-Setup mit Trigger, Invalidation und Wahrscheinlichkeit
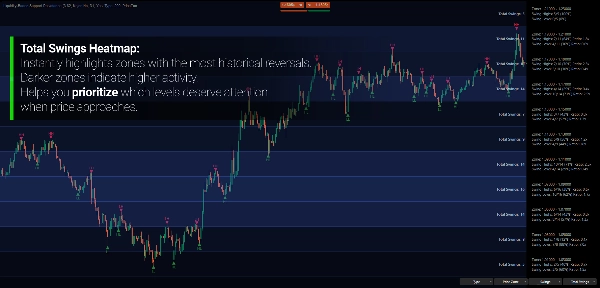
Heatmap-Visualisierung
Verwandeln Sie Rohdaten in sofortige visuelle Einsichten. Die Heatmap kodiert jede Metrik über alle sichtbaren Zonen mit einem dreipunktigen Farbverlauf – kalt, mittel, heiß.
Anstatt Zahlen auf jedem Level zu lesen, sehen Sie Muster auf einen Blick:
- Wo konzentriert sich das Volumen?
- Welche Zonen zeigen starke Richtungs-Bias?
- Wo ist die Effizienz am höchsten?
- Welche Levels haben den größten Aufwand absorbiert?
17 Heatmap-Modi verfügbar:
- Aktivität – Gesamt-Swings, Swing-Hochs, Swing-Tiefs
- Verhältnisse – Hoch/Tief-Verhältnis, Tiefen-Verhältnis, Volumen-Verhältnis, Dauer-Verhältnis
- Rohmetriken – Tiefe, Volumen
- Berechnet – Effizienz, Absorption, Überzeugung, Richtungs-Bias
Multi-Timeframe-Analyse
Analysieren Sie Swing-Strukturen höherer Zeitrahmen, während Sie die Preisbewegung niedrigerer Zeitrahmen betrachten. Sehen Sie tägliche Swing-Aktivität, die auf H1-Zonen abgebildet ist, ohne Charts zu wechseln.
Doppelter Anzeigemodus
- Preis-Level – Traditionelle Einzel-Linie an der Rundzahl
- Preis-Zone – Obere und untere Grenzen, die die volle Zonenbreite zeigen
Adaptive Zonenabstände
Setzen Sie den Multiplikator auf null, und der Indikator berechnet automatisch die optimale Zonenbreite basierend auf der durchschnittlichen Swing-Tiefe Ihres Instruments. Funktioniert über Forex, Indizes, Krypto und Rohstoffe ohne manuelle Anpassung.
INTERPRETATION & SETUP-MODUS
Der Indikator zeigt nicht nur Daten – er synthetisiert Metriken in eine Analyse, auf die Sie reagieren können.
Interpretationsmodus bietet:
- Bias-Bewertung (Stark/Moderat/Leicht Angebot oder Nachfrage)
- Kontrollidentifikation (Käufer, Verkäufer oder Ausgeglichen)
- Aufwandsanalyse (wer arbeitet härter, um die Position zu halten)
- Energielevel (Hoch/Mittel/Niedrig relativ zur Basislinie)
- Ausblicksaussage, die das wahrscheinliche Verhalten beschreibt
Setup-Modus geht weiter:
- Richtungs-Bias (Long, Short oder Neutral)
- Einstiegs-Trigger-Bedingung
- Invalidierungskriterien
- Wahrscheinlichkeitsbewertung (Hoch/Mittel/Niedrig/Sehr Niedrig)
- Warnung bei Signal-Konflikten
Beispielausgabe:
"Setup: Long | Wahrscheinlichkeit: Mittel" "Trigger: Durchbruch und Schluss über der Zone" "Invalidierung: Schluss zurück unter der Zone"
DIE ZONEN LESEN
Angebotszone – Mehr Swing-Hochs als Tiefs. Der Preis neigt dazu, hier nach unten umzudrehen. Verkäufer haben dieses Level historisch verteidigt.
Nachfragezone – Mehr Swing-Tiefs als Hochs. Der Preis neigt dazu, hier nach oben umzudrehen. Käufer haben dieses Level historisch verteidigt.
Umkämpfte Zone – Ungefähr gleich viele Swing-Hochs und Tiefs. Kein klarer Richtungs-Bias. Führt oft zu explosiven Bewegungen, sobald sie aufgelöst ist.
Hohe Energie – Bedeutende Volumenabsorption relativ zur Basislinie. Das Level wird aktiv umkämpft.
Niedrige Energie – Minimale Aktivität. Das Level kann leicht brechen oder einfach ignoriert werden.
Effizienz-Ungleichgewicht – Wenn eine Seite den Preis pro Volumeneinheit weiter bewegt, hat sie die Kontrolle, unabhängig davon, wer mehr Aufwand betreibt.
FÜR WEN ES GEEIGNET IST
Dieser Indikator ist für Trader konzipiert, die Kontext hinter ihren Levels wollen, nicht nur Linien in einem Chart.
Er eignet sich gut für strukturorientierte Trader, die Konzepte wie Volumenanalyse, Aufwand vs. Ergebnis oder Angebots-/Nachfragedynamik in ihre Entscheidungsfindung einbeziehen.
Swing- und Positions-Trader profitieren davon, zu sehen, welche Levels institutionelles Gewicht tragen, bevor sie Einstiege planen.
Multi-Timeframe-Analysten können die Liquiditätsstruktur höherer Zeitrahmen direkt auf Ausführungs-Charts sehen.
Dies ist kein Signalgeber. Es ist ein kontextuelles Framework zum Verständnis dessen, was der Markt auf Schlüsselpreislevels getan hat – und was das über zukünftiges Verhalten aussagt.
WAS ES UNTERSCHEIDET
Die meisten Unterstützungs- und Widerstandsindikatoren beantworten die Frage: "Wo hat der Preis umgekehrt?"
Dieser Indikator beantwortet: "Was ist passiert, als der Preis dort umgekehrt ist, und was sagt uns das?"
Indem er die Aktivität auf jedem Level quantifiziert – und nicht nur markiert, wo Swings stattfanden – gewinnen Sie Einblicke in:
- Ob ein Level wahrscheinlich hält oder bricht
- Welche Seite effizienter agiert hat
- Ob Energie für einen Ausbruch oder Erschöpfung aufgebaut wird
- Wie man einen Trade um das Level mit definiertem Trigger und Invalidation strukturiert
Die Analyse passt sich automatisch Ihrem Instrument an. Keine Optimierung erforderlich – die Marktstruktur definiert die Parameter.
---
VERSTEHEN DER LIQUIDITÄT AUF PREISLEVELS
Unterstützung und Widerstand sind keine magischen Linien, an denen der Preis abprallt. Sie sind Zonen, in denen entgegengesetzte Interessen konzentriert sind.
Auf einem Unterstützungslevel waren Käufer historisch bereit, Verkaufsdruck zu absorbieren. Beim Widerstand haben Verkäufer Kaufdruck absorbiert. Die Stärke eines Levels hängt nicht davon ab, wie oft es berührt wurde, sondern davon, wie viel erforderlich war, um es zu halten – und ob diese Verteidigung intakt bleibt.
Deshalb können zwei Levels mit identischer Preisgeschichte sich völlig unterschiedlich verhalten. Das eine hat möglicherweise enormes Volumen absorbiert, um zu halten – was auf eine baldige Erschöpfung hindeutet. Das andere hat den Preis mühelos abgelehnt – was auf starke Überzeugung hinweist.
Indikatoren, die auf diesem Konzept basieren, sagen nicht voraus, wohin der Preis gehen wird. Sie helfen Ihnen zu verstehen, was bereits passiert ist auf Schlüssellevels, damit Sie bessere Entscheidungen treffen können, wenn der Preis zurückkehrt.
---
Hinweis: Dieser Indikator modelliert Liquiditätsdynamiken durch Tick-Volumen und Preisinteraktion – nicht durch direkte Orderbuchdaten. Während Tick-Volumen die Broker-Ebene und nicht das Börsenvolumen repräsentiert, zeigt es zuverlässig relative Beteiligungsniveaus an und korreliert mit tatsächlichen Marktvolumenmustern.
Trading beinhaltet Risiken. Dieser Indikator ist ein Werkzeug der technischen Analyse – wenden Sie stets ein angemessenes Risikomanagement an.


