Beschreibung
LogicLadder Pivots – Fortgeschrittener Marktstruktur- & Musterscanner
Entdecken Sie die verborgene Struktur des Marktes mit LogicLadder Pivots.
Der LogicLadder Pivots Indikator ist ein professionelles Price-Action-Tool, das Tradern hilft, die Marktstruktur zu visualisieren, Trends zu erkennen und automatisch hochwahrscheinliche Umkehrmuster zu identifizieren. Durch die Kombination der klassischen ZigZag-Logik mit fortschrittlicher Multi-Timeframe-Überwachung fungiert dieses Tool als Ihr persönlicher Marktanalyst, hält Ihre Charts übersichtlich und warnt Sie vor kritischen Kursbewegungen.
🚀 Hauptmerkmale
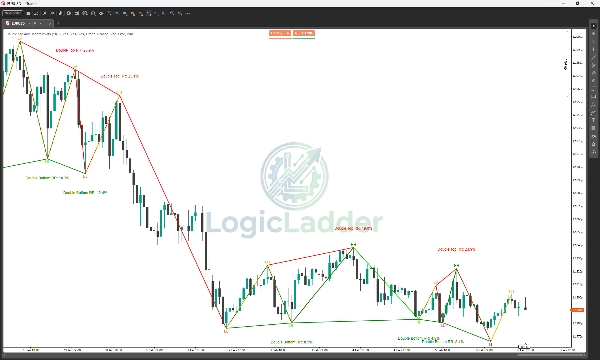
- Automatisierte Marktstruktur: Kennzeichnet automatisch Höhere Hochs (HH), Niedrigere Hochs (LH), Höhere Tiefs (HL) und Niedrigere Tiefs (LL), sodass Sie sofort die aktuelle Trendrichtung erkennen können.
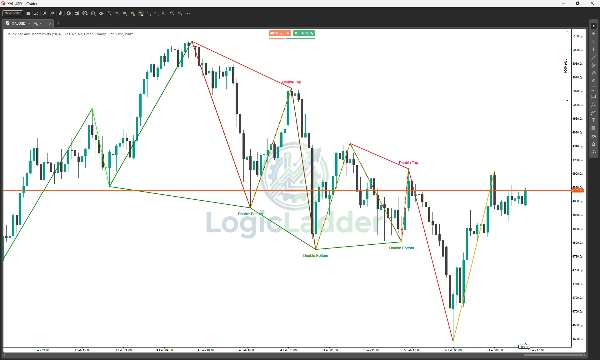
- Intelligente Mustenerkennung: Erkennt in Echtzeit Doppeltop und Doppelboden-Formationen. Es findet nicht nur Muster, sondern filtert sie basierend auf einem berechneten Risiko-Ertrags-Verhältnis (RR), damit Sie nur die aussichtsreichsten Setups sehen.
- Multi-Timeframe (MTF) Alarme: Überwachen Sie einen höheren Zeitrahmen (z. B. H4 oder Daily), während Sie in einem niedrigeren Zeitrahmen handeln. Der Indikator warnt Sie, wenn sich auf Ihrem beobachteten Zeitrahmen wichtige Pivot-Punkte bilden, sodass Sie nie gegen den Haupttrend handeln.
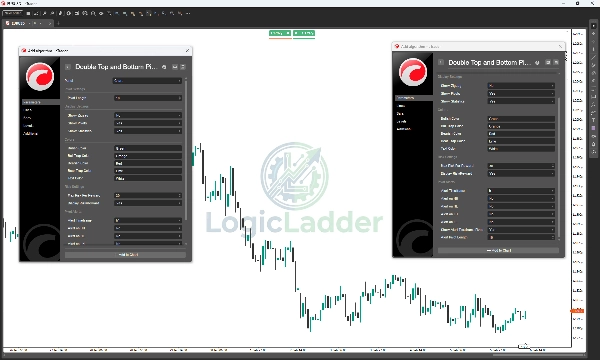
- Interaktives Statistik-Panel: Ein übersichtliches Dashboard auf dem Chart zeigt den aktuellen Status der Mustersuche (Scanning, Doppeltop erkannt usw.).
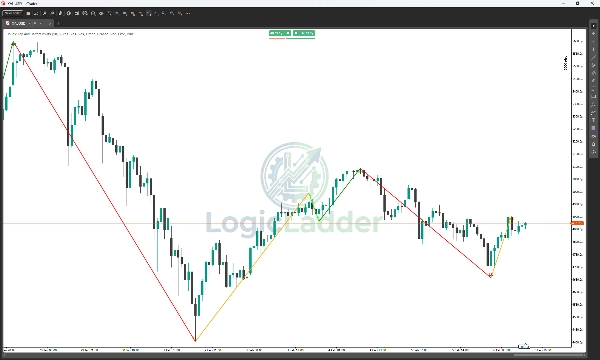
- ZigZag-Visualisierung: Zeichnet klare, anpassbare Trendlinien, die das Rauschen durchdringen und Ihnen helfen, sich auf bedeutende Kursbewegungen zu konzentrieren.
- Vollständig anpassbar: Passen Sie jeden Aspekt des Indikators an Ihren Handelsstil an. Stellen Sie die Pivot-Empfindlichkeit (Länge) ein, ändern Sie die Farben für bullische/bärische Strukturen und schalten Sie verschiedene visuelle Elemente ein oder aus.
🎨 Visueller Leitfaden & Farbstrategie
Das LogicLadder System verwendet einen spezifischen 4-Farben-Code, um Ihnen die Geschichte der Marktstruktur sofort zu erzählen. So lesen Sie die "Leiter":
1. 🟢 Grün (Bullisch - Stark)
- Was es ist: Wird für Höhere Hochs (HH) verwendet.
- Was es bedeutet: Käufer haben die volle Kontrolle. Der Markt erreicht neue Höchststände.
- Aktion: Suchen Sie nach Kaufgelegenheiten oder halten Sie bestehende Long-Positionen.
2. 🔴 Rot (Bärisch - Stark)
- Was es ist: Wird für Niedrigere Tiefs (LL) verwendet.
- Was es bedeutet: Verkäufer haben die volle Kontrolle. Der Markt fällt auf neue Tiefststände.
- Aktion: Suchen Sie nach Verkaufsgelegenheiten oder halten Sie bestehende Short-Positionen.
3. 🟠 Orange (Bull Trap - Schwäche)
- Was es ist: Wird für Niedrigere Hochs (LH) verwendet.
- Was es bedeutet: Käufer versuchten, den Preis zu erhöhen, konnten das vorherige Hoch jedoch nicht durchbrechen. Dies ist eine "Bull Trap" – späte Käufer sind nun gefangen, da die Dynamik nachlässt.
- Aktion: Warnsignal! Wenn Sie Long sind, sollten Sie Gewinne mitnehmen. Beobachten Sie eine mögliche Trendwende nach unten.
4. 🟢 Limette (Bear Trap - Stärke)
- Was es ist: Wird für Höhere Tiefs (HL) verwendet.
- Was es bedeutet: Verkäufer versuchten, den Preis zu senken, konnten das vorherige Tief jedoch nicht durchbrechen. Dies ist eine "Bear Trap" – späte Verkäufer sind gefangen, da die Unterstützung hält.
- Aktion: Gelegenheitssignal! Dies deutet oft den Beginn eines neuen Aufwärtstrends an. Beobachten Sie Einstiegssignale für Long-Positionen.
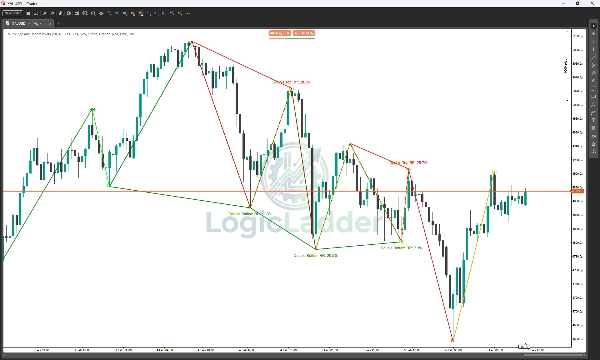
📉 Wie man die "Leiter" handelt
- Aufwärtstrend-Modus: Sie möchten ein Muster aus Grün (HH) sehen, das mit Limette (HL) verbunden ist. Dies bestätigt eine gesunde, steigende Leiter.
- Abwärtstrend-Modus: Sie möchten ein Muster aus Rot (LL) sehen, das mit Orange (LH) verbunden ist. Dies bestätigt eine steile, fallende Leiter.
- Umkehrerkennung:
-
- Potentielles Hoch: Wenn Sie ein Grün (HH) gefolgt von einem Orange (LH) sehen, verliert der Aufwärtstrend an Energie.
- Potentielles Tief: Wenn Sie ein Rot (LL) gefolgt von einem Limette (HL) sehen, ist der Verkaufsdruck erschöpft.
💡 Wie es funktioniert
- Pivot-Analyse: Der Indikator analysiert einen benutzerdefinierten Rückblickzeitraum (Standard: 10 Kerzen), um signifikante Swing-Hochs und -Tiefs zu identifizieren.
- Trend-Logik: Er verbindet diese Punkte, um die "Leiter" des Preises zu visualisieren – zeigt Ihnen genau, wann ein Trend die Struktur bricht oder Unterstützung/Widerstand respektiert.
- Umkehrbestätigung: Wenn die Kursbewegung eine "W" (Doppelboden) oder "M" (Doppeltop) Struktur bildet, die Ihre Risiko-Ertrags-Kriterien erfüllt, zeichnet der Indikator das Muster im Chart und aktualisiert das Status-Panel.
🔔 Alarme & Benachrichtigungen
Bleiben Sie informiert, ohne ständig auf den Bildschirm zu starren. LogicLadder Pivots beinhaltet ein robustes Alarmsystem:
- Protokollalarme: Detaillierte Nachrichten werden im cTrader-Protokoll ausgegeben, wenn Muster oder Pivots auftreten.
- MTF-Überwachung: Erhalten Sie Benachrichtigungen, wenn sich auf Ihrem gewählten Alarmzeitrahmen ein strukturelles Pivot-Hoch oder -Tief bildet (z. B. eine Warnung für ein 4-Stunden-Pivot-Tief beim Scalpen im 5-Minuten-Chart).
⚙️ Parameter
- Pivot-Länge: Empfindlichkeit der Swing-Erkennung.
- Label-Versatz: Passt den Abstand der Textbeschriftungen von den Kerzendochten für bessere Sichtbarkeit an.
- Max. Risiko pro Ertrag: Filtert Muster basierend auf Effizienz (Standard: 30%).
- Alarmzeitrahmen: Wählen Sie einen sekundären Zeitrahmen zur Überwachung.
- Visuelle Einstellungen: Volle Kontrolle über Farben für bullische, bärische und Trap-Bewegungen.
Zusammenfassung
The indicator detects Double Top and Double Bottom reversal patterns in real-time, filtering them by a calculated Risk-to-Reward ratio to highlight the most actionable setups. It supports alerts for pivot formations on higher timeframes while trading on lower ones, helping users align trades with major trends.
A customizable on-chart stats panel displays the current pattern detection status, and clear ZigZag trend lines visualize significant price swings. Users can adjust pivot sensitivity, label positioning, and color schemes for bullish, bearish, and trap moves to fit their trading style.
The tool employs a four-color system to represent market conditions: green for strong bullish moves (HH), red for strong bearish moves (LL), orange for bull traps (LH), and lime for bear traps (HL). This visual guide aids in spotting trend continuations and potential reversals. Alerts include detailed log messages and MTF notifications to keep traders informed.