present
Registrieren Sie sich und erhalten Sie $50 Rabatt auf Ihren ersten Kauf
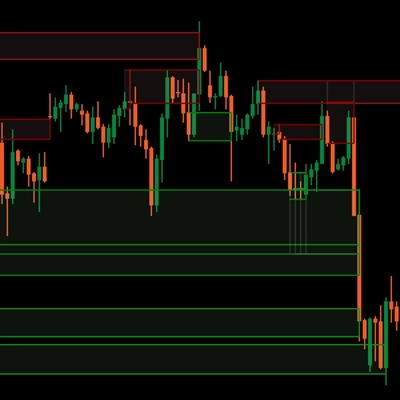
Trading product for Volume_Momentum_HeatMap-Liquidity-style Indikator Scalping Key Levels, image 1
Volume_Momentum_HeatMap-Liquidity-style
Indikator
Version 2.0, Apr 2026
Windows, Mac
4.5
Bewertungen: 4
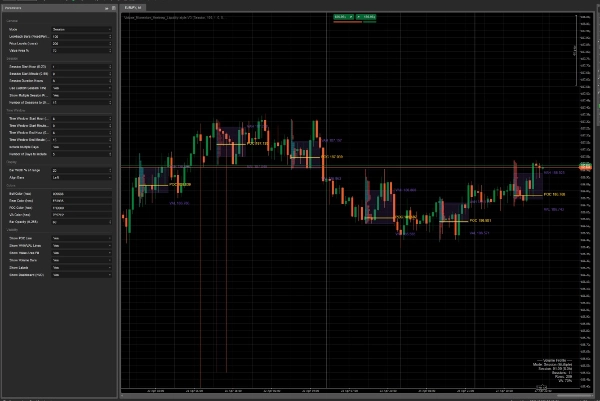
Trading product for Volume_Momentum_HeatMap-Liquidity-style Indikator Scalping Key Levels, image 2
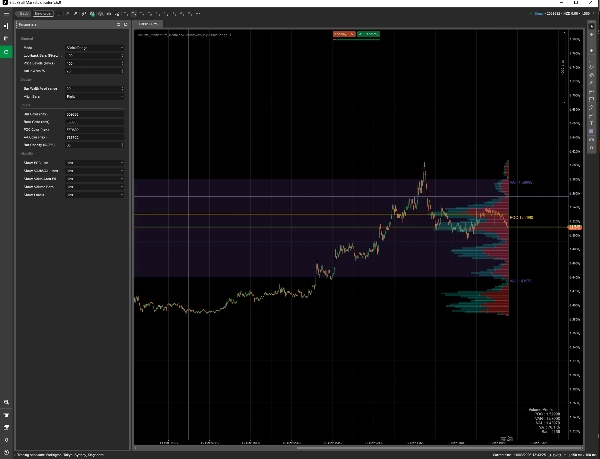
Trading product for Volume_Momentum_HeatMap-Liquidity-style Indikator Scalping Key Levels, image 3
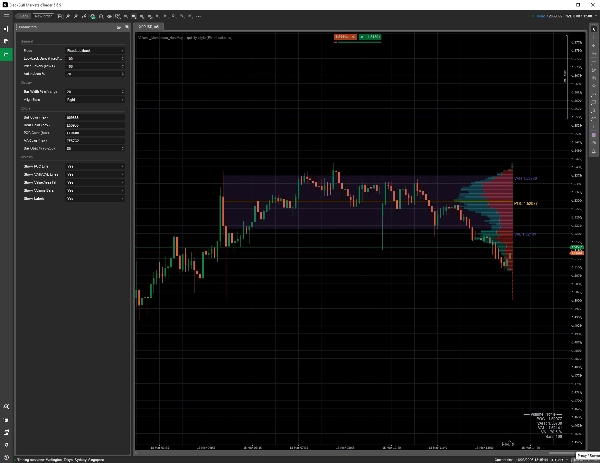
Trading product for Volume_Momentum_HeatMap-Liquidity-style Indikator Scalping Key Levels, image 4
Trading product for Volume_Momentum_HeatMap-Liquidity-style Indikator Scalping Key Levels, image 5
Seit 23/04/2025
2
Verkäufe

Beschreibung

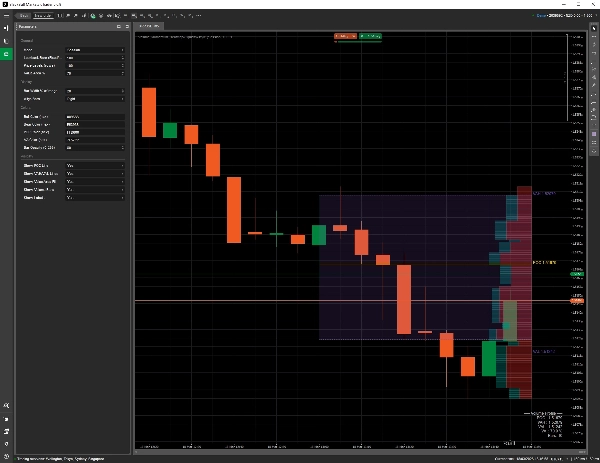
Volume Profile HeatMap ist ein cTrader-Chartindikator zur Analyse, wo sich die Handelsaktivität über Preisniveaus konzentriert hat. Er zeichnet eine Volumenprofil-ähnliche Heatmap mit POC, Wertbereich und optionalen visuellen Handelsszenario-Markierungen.


Was er macht:

- Zeigt eine Volumenprofil-ähnliche Heatmap direkt im Chart an

- Hebt POC, VAH, VAL, Hochvolumenknoten und Niedrigvolumenbereiche hervor

- Unterstützt sichtbaren Bereich, festen Rückblick, Sitzungs- und Zeitfenstermodi

- Kann mehrere Sitzungsprofile anzeigen

- Zeichnet optional Wertbereichsfüllung, erweiterte Wertbereichszonen, Beschriftungen und Dashboard-Informationen

- Enthält optionale Musterbeschriftungen und Signalpfeile für visuelle Handelsplanung

- Zeichnet visuelle Einstiegs-, Stopp- und Ziel-Szenarien, wenn aktiviert


Handelsansatz:

Der Indikator ist für Trader konzipiert, die Volumenkonzentration, Wertbereich und Sitzungszusammenhang zur Planung manueller Trades nutzen. Er hilft dabei, Zonen zu identifizieren, in denen der Preis zuvor Wert akzeptiert oder abgelehnt hat, garantiert jedoch nicht, dass diese Zonen unter Live-Markbedingungen halten.


Wichtige Parameter:

- Profilmodus

- Rückblick-Bars

- Sitzungsstartzeit und Dauer

- Anzahl der anzuzeigenden Sitzungen

- Mustererkennung und Signalpfeile

- Zeitfensterauswahl

- Anzahl der Preisniveaus

- Wertbereichsprozentsatz

- Balkenbreite und Ausrichtung

- POC, VAH, VAL, Wertbereichsfüllung, Beschriftungen und Dashboard-Sichtbarkeit

- Risiko-Ertrags-Verhältnis für visuelle Handelsszenarien


Für wen es ist:

- Intraday-Trader, die Wertbereichs- und POC-Niveaus nutzen

- Trader, die visuellen Support- und Resistance-Kontext suchen

- Manuelle Trader, die eine Volumenprofil-ähnliche Überlagerung innerhalb von cTrader wünschen

- Strategietester, die Sitzungsverhalten und potenzielle Reaktionszonen überprüfen möchten


Wichtige Einschränkungen:

Dies ist ein Indikator, kein Handelsroboter. Er sendet keine Live-Aufträge. Die Handelssymbole sind nur visuelle Szenarien. Der Indikator verwendet Chart-/Broker-Volumendaten, die in cTrader verfügbar sind und von zentralisierten Börsenvolumen- oder Futures-Orderflow-Daten abweichen können.


Risikohinweis:

Handel beinhaltet Risiken. POC, VAH, VAL, HVN und LVN Zonen sind Analysetools, keine garantierten Umkehr- oder Ausbruchslevels. Testen Sie Einstellungen im Demo-Modus und verwenden Sie unabhängiges Risikomanagement.


Zusammenfassung

KI-Zusammenfassung
Volume_Momentum_HeatMap-Liquidity-style is a cTrader chart indicator designed to visualize trading volume concentration across price levels using a volume-profile heatmap. It highlights key volume-based zones such as Point of Control (POC), Value Area High (VAH), Value Area Low (VAL), High Volume Nodes (HVN), and Low Volume Nodes (LVN). The indicator supports multiple profile modes including visible range, fixed lookback, session, and customizable time windows, allowing users to display one or multiple session profiles.

Key features include optional value area fills, extended value area zones, labels, and a dashboard for summary information. It also offers pattern recognition with signal arrows and visual trade scenario markers such as entry, stop, and target levels based on configurable risk/reward ratios. Users can adjust parameters like profile mode, lookback bars, session timing, number of price levels, and visibility of various elements to tailor the analysis.

This tool is intended for intraday and manual traders who utilize volume profile, value areas, and session context to identify support and resistance zones and plan trades visually. It relies on chart volume data available in cTrader and does not execute trades automatically. The indicator serves as an analytical overlay to assist in trade planning and session behavior review.
Indikatorprofil
Indikatorkategorie
Momentum
Ausgabetyp
Visualisierung
Signale
Filter
Datenanforderungen
Volumen
Unterstützte Signale
Volatilität
Level – Berührung
Eröffnungsspanne der Sitzung

Kundenbewertungen

4.5
Bewertungen: 4
5
50 %
4
50 %
3
0 %
2
0 %
1
0 %
Kundenbewertungen
March 31, 2026
Not some auto win thing, but it has a clear role. It helps with smart money style analysis, while the weak spot is that zones still need manual validation. Early sizing should stay modest until the journal looks stable.
March 24, 2026
Tbh the value is mostly in filtering bad ideas. I still would not trust it live without checking the chart myself. The weak spot shows up when risk stops matching the setup.705 caution area.
March 22, 2026
the product feels more useful when the plan is already written down. A 97 setup run on daily close keeps the review grounded.
March 22, 2026
After 3 sessions, the useful part became clearer. 20 FVG reactions was enough to see whether it helped, and 0.5 mitigation kept the test grounded.

Diskussion

Häufig gestellte Fragen (FAQ)

Scalping
Key Levels
Volume
Support & Resistance
Über den cTrader Store verfügbare Produkte, einschließlich Handelsbots, Indikatoren und Plugins, werden von externen Entwicklern bereitgestellt und nur zu Informations- und technischen Zugriffszwecken verfügbar gemacht. cTrader Store ist kein Broker und erbringt keine Anlageberatung, persönlichen Empfehlungen oder eine Garantie für zukünftige Performance.

Mehr von diesem Autor

Indikator
Signal
Trades Opening Range Breakouts Indicator with dynamic stops/targets adapting to market volatility.

Das könnte Sie auch noch interessieren

Indikator
VWAP
Volume
+4
Advanced Order Flow & Volume Profiling for cTrader. Unveil institutional footprints, Delta, and Anchored VWAPs.
Indikator
RSI
Forex
+7
Advanced S/R + liquidity zone detector with auto-configured trade styles. Generates filtered entry signals with TP/SL.
Indikator
ATR
EMA
+4
The FULL-MARKET-VIEW-DASHBOARD is a professional-grade trading suite for cTrader that eliminates market noise.
Indikator
ATR
Fibonacci
+4
Emperor Signals Pro is a premium non-repainting indicator for Forex pairs on the 15-minute timeframe
Indikator
ADX
ATR
+3
Precision sniper-style confluence entries with graded signals, auto SL/TP & live backtest — 7 presets, MTF bias.
Indikator
Volume
Imbalance
+2
FOOTPRINT PRO - Candles tell you where price moved
Indikator
SMC
Prop
+13
Tracks virgin levels. Lines vanish only after a candle closes beyond the high/low on your chosen timeframe.
Indikator
Ultra-Flexible VWAP Indicator with Advanced Customization
Indikator
Forex
Crypto
+5
Experience a new approach with amplitude-based momentum analysis. Smart Trend Detection That Adapts to Market Volatility
Indikator
Prop
Forex
+12
Half Trend Cloud
Indikator
RSI
Breakout
+1
📊 Liquidation Map: Potential areas where highly leveraged investors might face liquidations.
Indikator
Imbalance
Risk Dashboard
+2
FX‑DESK RISK MANAGEMENT — Cross‑Asset Correlation Heatmap, Info Panel & Trade Signals
Indikator
Prop
Forex
+13
"Footprint Chart: Visualize bid-ask volume inside candles for clearer order flow and market depth insights."
Indikator
BOS
VWAP
+4
Gold premiun XAUUSD Exclusive Real-Time Adaptive Intelligence
Indikator
Signal
Order Flow Market Depth Pro | Footprint & DOM
Indikator
RSI
Signal
+1
Multi-timeframe version of the Quantitative Qualitative Estimation (QQE) indicator.
Indikator
CHOCH
Fair Value Gap
+2
Advanced FVG & IFVG indicator with multi-timeframe confluence, CHoCH filtering, and smart mitigation.
Indikator
Volume
Fibonacci
+5
Classic 9:30 Opening Range Breakout — auto-plots the range, flags volume-confirmed breakouts long or short, live.

Preis

Seit 23/04/2025
2
Verkäufe