

Beschreibung
RiskLotSizer ist ein chartbasiertes Positionsgrößen- und Risikomanagement-Indikator für cTrader, der entwickelt wurde, um Tradern zu helfen, die passende Handelsgröße schnell und visuell zu berechnen.
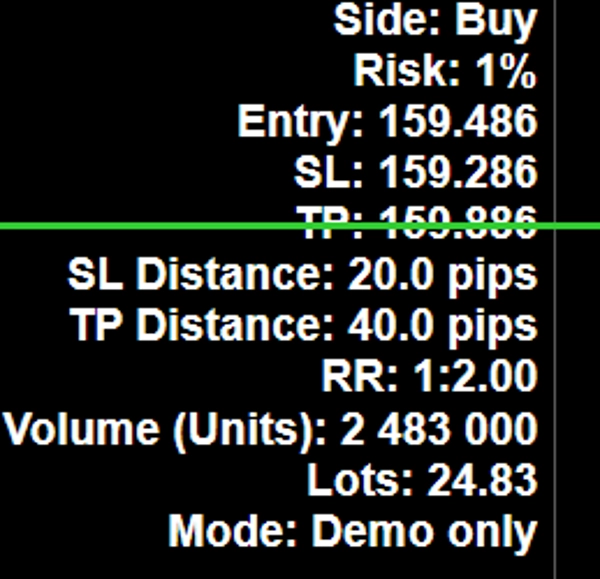
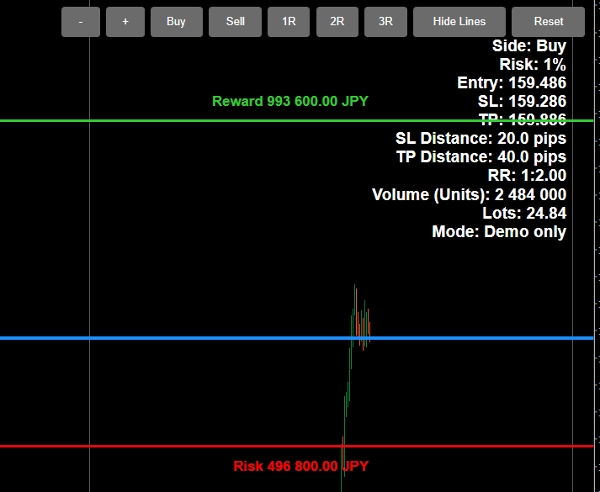
Der Indikator ermöglicht es Ihnen, Entry-, Stop-Loss- und Take-Profit-Niveaus direkt im Chart anzupassen, was die Planung von Trades in Echtzeit erleichtert. Basierend auf dem von Ihnen gewählten Risikoprozentanteil des Kontokapitals berechnet RiskLotSizer automatisch die Positionsgröße und zeigt die geschätzte Lotgröße, den Risikobetrag, den Gewinnbetrag und das Risiko-Ertrags-Verhältnis an.
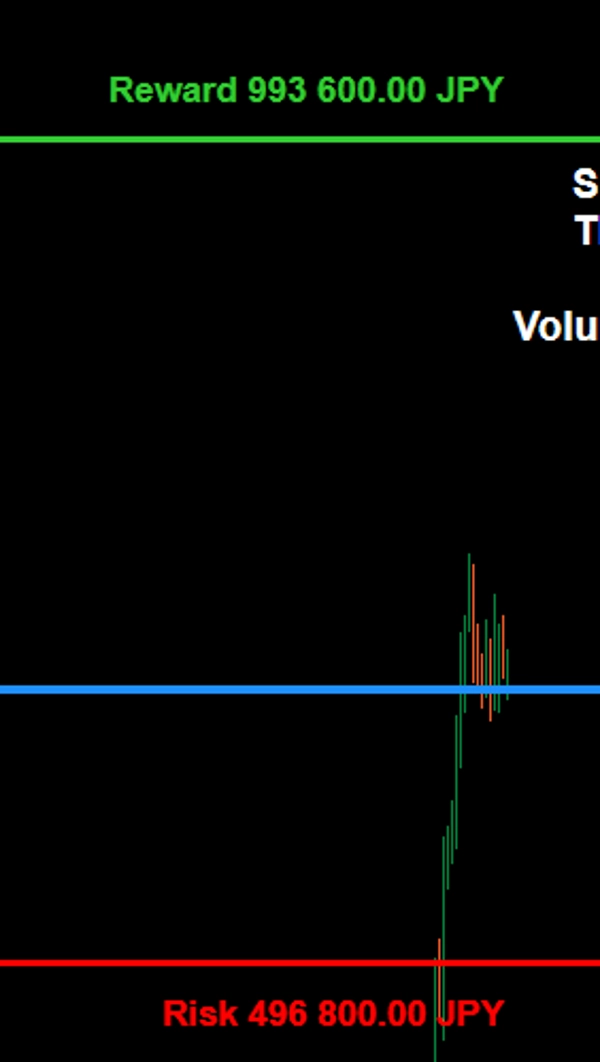
Er unterstützt sowohl Kauf- als auch Verkaufs-Szenarien und ist darauf ausgelegt, Tradern eine klare visuelle Übersicht über das Handelsrisiko vor dem Einstieg in eine Position zu geben. Risiko- und Gewinnwerte werden direkt in der Nähe der SL- und TP-Linien angezeigt, während das Hauptinformationspanel eine übersichtliche Zusammenfassung des Setups bietet.
Wichtige Funktionen umfassen:
- Berechnung der Lotgröße basierend auf einem gewählten Prozentsatz des Kapitals
- Anpassbare Entry-, SL- und TP-Linien direkt im Chart
- Echtzeit-Anzeige von Positionsgröße, Risikobetrag, Gewinnbetrag und Risiko-Ertrags-Verhältnis
- Unterstützung für sowohl Kauf- als auch Verkaufsmodi
- Schnelle RR-Voreinstellungstasten für eine schnellere Handelsplanung
- Unterstützung für Englisch und Japanisch
- Umschaltung der Linienanzeige für einen saubereren Chart bei Bedarf
RiskLotSizer ist ideal für diskretionäre Trader, Daytrader und alle, die eine schnellere und klarere Methode zur Positionsgrößenbestimmung bei gleichzeitiger konsequenter Risikokontrolle suchen.
RiskLotSizer は、チャート上で直感的にポジションサイズを計算できる cTrader 用のポジションサイジング・リスク管理インジケーターです。
Entry、Stop Loss、Take Profit の各ラインをチャート上で直接動かしながら、指定した有効証拠金比率に基づく適正ロット数を自動計算します。これにより、トレード前に必要なロット数、想定損失額、想定利益額、Risk/Reward をリアルタイムで把握できます。
Buy / Sell の両方に対応しており、RR プリセットボタンによって利確目標の調整も素早く行えます。また、SL・TP 付近には損失額・利益額が表示されるため、視覚的にも分かりやすく、実践的なトレード設計をサポートします。
主な特長:
- 有効証拠金に対する指定リスク率からロット数を自動計算
- Entry / SL / TP をチャート上で直接調整可能
- ロット数、損失額、利益額、RR をリアルタイム表示
- Buy / Sell の両方に対応
- RR プリセットボタン搭載
- 英語 / 日本語切替対応
- 必要に応じてライン表示の ON / OFF が可能
RiskLotSizer は、裁量トレーダー、デイトレーダー、そして一貫したリスク管理を重視するトレーダーに適したインジケーターです。
Zusammenfassung
Kundenbewertungen
5 | 0 % | |
4 | 100 % | |
3 | 0 % | |
2 | 0 % | |
1 | 0 % |





![„[Hamster-Coder] Pivot Points MTF“-Logo](https://cdn.ctrader.com/image/webp/4c143e5a-309c-40e3-a578-f04d1e133ffa_31159)












