
Beschreibung
WAS ES TUT
Der Fibonacci-Kanal löst ein Problem, das die meisten Fibonacci-Werkzeuge ignorieren: Wo Sie verankern, ist wichtiger als welche Levels Sie zeichnen.
Die meisten Trader wenden Fibonacci-Retracements manuell an – sie wählen ein Swing-High und Swing-Low, zeichnen das Werkzeug und hoffen, dass die Struktur hält. Das Ergebnis ist eine statische Momentaufnahme, die irrelevant wird, sobald der Preis über eines der Extreme hinausgeht.
Dieser Indikator ändert den Ansatz.
Anstatt an einem festen Swing zu fixieren, verankert sich der Fibonacci-Kanal an einem von Ihnen gewählten Punkt und verfolgt kontinuierlich das höchste Hoch und das tiefste Tief von diesem Anker bis zur aktuellen Kerze. Wenn sich die Spanne erweitert, wächst der Kanal mit. Die Fibonacci-Level spiegeln immer die tatsächlich entwickelte Spanne wider – nicht eine historische Schätzung.
Der Kanal wächst mit dem Markt. Die Levels bleiben aussagekräftig.
Die Richtung wird automatisch verfolgt. In einem bullischen Kontext messen die Levels von oben nach unten. In einem bärischen Kontext messen sie von unten nach oben. Keine manuelle Anpassung erforderlich – der Indikator liest die Struktur und richtet sich entsprechend aus.
WARUM ANKERBASIERTE FIBONACCI?
Das Problem
Standard-Fibonacci-Werkzeuge werden zwischen zwei festen Punkten gezeichnet. Sobald der Preis eines der Extreme überschreitet, ist das Werkzeug nicht mehr gültig – Sie müssen es manuell neu zeichnen. Dies erzeugt einen ständigen Anpassungszyklus, und die Fibonacci-Karte spiegelt nie genau die gesamte tatsächlich entwickelte Spanne wider.
Es gibt auch ein tieferes Problem: Wo Sie den Anker setzen, definiert alles. Eine willkürliche Platzierung erzeugt willkürliche Levels.
Die Lösung
Der Fibonacci-Kanal gibt Ihnen bewusste Kontrolle über den Ankerpunkt – und übernimmt dann alles automatisch. Platzieren Sie den Anker an einer strukturell bedeutenden Kerze (ein Trendbeginn, eine Schlüsselwende, eine Sitzungseröffnung), und der Indikator baut die gesamte Spanne von diesem Punkt aus auf. Jedes neue Hoch oder Tief, das der Markt bildet, wird Teil des Kanals. Die Fibonacci-Level aktualisieren sich in Echtzeit.
Der Anker ist verschiebbar. Bewegen Sie ihn im Chart, und der gesamte Kanal wird sofort neu gezeichnet.
Warum mehrere Modi?
Das vollständige Fibonacci-Gitter ist nicht immer das, was Sie brauchen. Manchmal liegt der Fokus auf der Retracement-Zone zwischen 38,2 % und 61,8 %. Manchmal möchten Sie die Struktur nur in der oberen oder unteren Hälfte der Spanne isolieren.
Sieben verschiedene Kanalmodi ermöglichen es Ihnen, genau das Detailniveau anzuwenden, das die Situation erfordert – ohne den Chart mit Levels zu überladen, die Sie nicht verwenden.
DAS KERNKONZEPT
Der Indikator arbeitet in einem einzigen Vorwärtsdurchlauf vom Anker aus:
- Sie platzieren das Ankersymbol auf einer Kerze Ihrer Wahl
- Ab dieser Kerze verfolgt der Indikator das laufende höchste Hoch und tiefste Tief
- Die Kanalgrenzen (High Line, Low Line) spiegeln diese sich erweiternde Spanne wider
- Fibonacci-Level werden innerhalb der Spanne berechnet, orientiert an der Trendrichtung
- Bewegen Sie den Anker – der Kanal berechnet sich sofort neu
Die Trendrichtung wird bestimmt, indem der aktuelle Schlusskurs mit dem Eröffnungskurs der Ankerkerze verglichen wird. Bullisch: Levels messen von oben nach unten vom Hoch. Bärisch: Levels messen von unten nach oben vom Tief. Wenn sich der richtungsbezogene Kontext des Marktes ändert, richtet sich der Kanal automatisch neu aus.
Der Anker rastet an Kerzeneröffnungszeiten und -preisen ein für eine saubere, reproduzierbare Platzierung.
KANALMODI
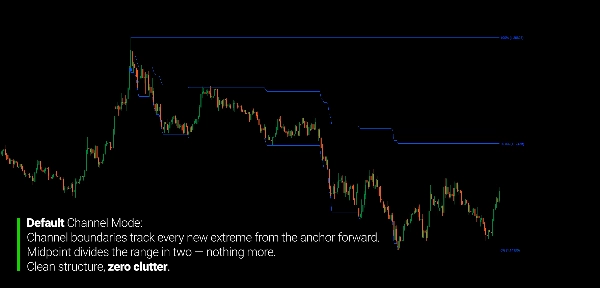
Standard Nur High Line, Low Line und Middle Line. Saubere Ansicht der Spanne ohne interne Levels.
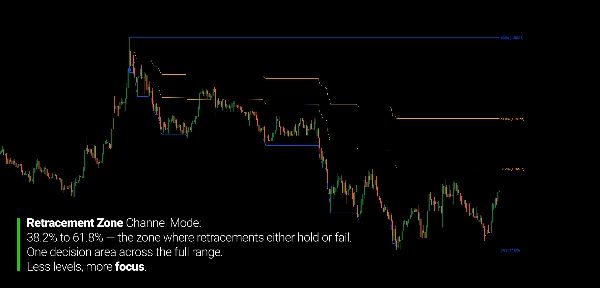
Retracement-Zone Fügt die 61,8 % und 38,2 % Levels hinzu – die Kern-Retracement-Zone innerhalb der gesamten Spanne. Am besten geeignet, um den primären Rückzugsbereich innerhalb einer Bewegung zu identifizieren.
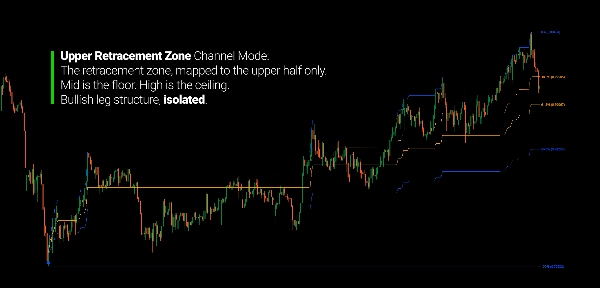
Obere Retracement-Zone Retracement-Zone, die auf die obere Hälfte des Kanals (zwischen Mitte und Hoch) abgebildet ist. Nützlich, um die Retracement-Struktur innerhalb eines Aufwärtssegments zu isolieren.
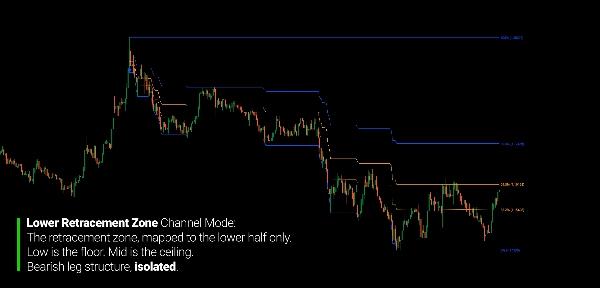
Untere Retracement-Zone Retracement-Zone, die auf die untere Hälfte (zwischen Tief und Mitte) abgebildet ist. Dieselbe Logik angewandt auf Abwärtsbewegungen.
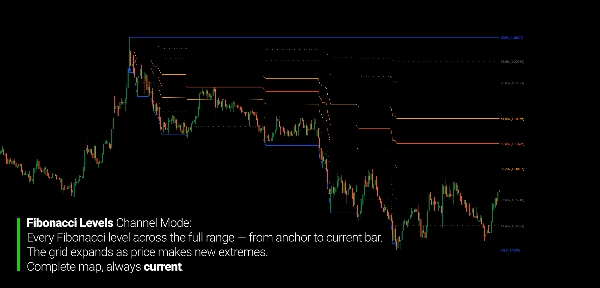
Fibonacci-Level Vollständiges Fibonacci-Gitter über die gesamte Spanne: 88,6 %, 78,6 %, 61,8 %, 50 %, 38,2 %, 23,6 %, 11,4 %. Für Trader, die die vollständige Level-Karte wünschen.
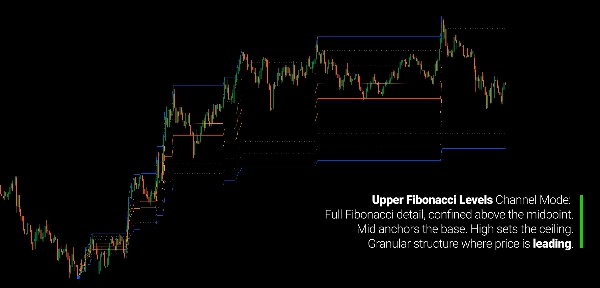
Obere Fibonacci-Level Vollständiges Fibonacci-Gitter, das nur auf die obere Hälfte des Kanals angewendet wird.
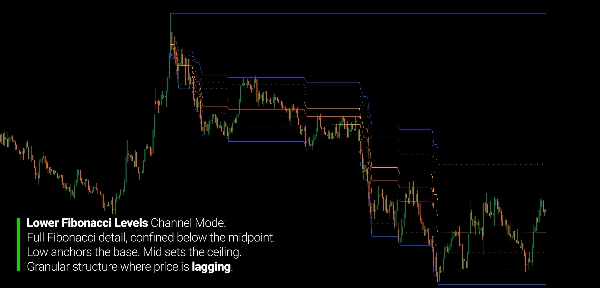
Untere Fibonacci-Level Vollständiges Fibonacci-Gitter, das nur auf die untere Hälfte des Kanals angewendet wird.
DEN CHART LESEN
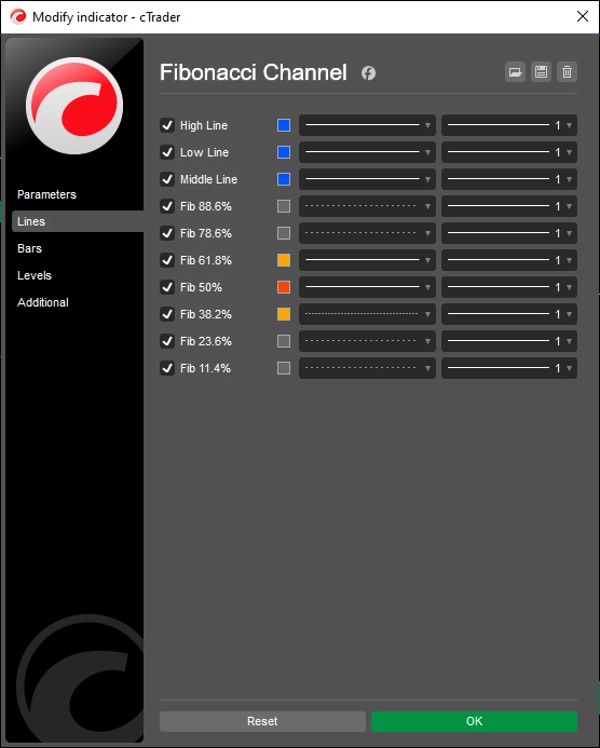
- High Line: Obere Begrenzung des Kanals (höchstes Hoch vom Anker)
- Low Line: Untere Begrenzung des Kanals (tiefstes Tief vom Anker)
- Middle Line: Mittelpunkt der gesamten Spanne
- 61,8 % / 38,2 %: Kern-Retracement-Zone (orange Linien)
- 50 %: Mittel-Retracement-Level (rot-orange)
- 78,6 % / 88,6 % / 23,6 % / 11,4 %: Erweiterte Fibonacci-Level (grau gepunktet)
- Ankersymbol: Verschiebbar – bewegen Sie es, um den Beginn des Kanals neu zu definieren
Richtungsreferenz:
- Bullischer Kontext → Levels orientieren sich von oben nach unten (Hoch = 0 %, Tief = 100 %)
- Bärischer Kontext → Levels orientieren sich von unten nach oben (Tief = 0 %, Hoch = 100 %)
- Die Richtung aktualisiert sich automatisch, wenn der letzte Schlusskurs den Anker-Eröffnungskurs kreuzt
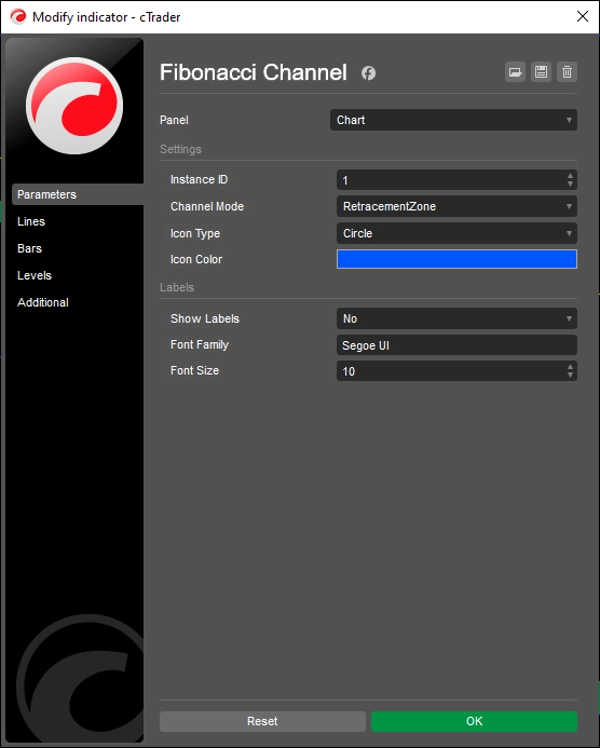
PARAMETER
Einstellungen
- Instanz-ID – unterstützt mehrere unabhängige Kanäle im selben Chart
- Kanalmodus – wählt aus, welche Levels angezeigt werden (7 Modi)
- Symboltyp – visueller Stil des verschiebbaren Ankers
- Symbolfarbe – Farbe des Ankersymbols
Beschriftungen
- Beschriftungen anzeigen – Umschalten der Preisschilder an jedem Level
- Schriftfamilie – Schriftart der Beschriftungen
- Schriftgröße – Größe der Beschriftungen (6–32)
FÜR WEN ES GEEIGNET IST
Dieser Indikator ist für Trader, die Fibonacci-Analyse als strukturelle Referenz und nicht als mechanisches Signalwerkzeug verwenden.
Wenn Sie Zeit damit verbracht haben, Fibonacci-Werkzeuge jedes Mal neu zu zeichnen, wenn der Preis ein neues Extrem erreicht – oder festgestellt haben, dass statische Retracements den Markt nach den ersten paar Kerzen nicht mehr widerspiegeln – wurde dieser Indikator genau dafür entwickelt.
Er eignet sich gut für Swing- und Positions-Trader, die eine Fibonacci-Karte wollen, die gültig bleibt, während sich der Preis entwickelt, Range- und Struktur-Trader, die mit Kanalgrenzen und Retracement-Zonen als Einstiegs- oder Ausstiegsreferenzen arbeiten, und Multi-Instance-Nutzer, die mehrere unabhängige Kanäle gleichzeitig über dasselbe Instrument verfolgen möchten.
Der verschiebbare Anker macht ihn in der Echtzeitanwendung praktisch: Setzen Sie den Kanalstart an einem strukturell wichtigen Punkt und lassen Sie den Indikator die Karte von dort aus pflegen. Keine Neuzeichnungen, keine manuellen Updates.
Dies ist kein Signalgenerator. Es ist ein strukturelles Referenzrahmenwerk für Trader, die Fibonacci-Level als Kontext verwenden – nicht als Einstiegssignale.
WAS ES UNTERSCHEIDET
Die meisten Fibonacci-Werkzeuge sind statisch: zwei feste Punkte, eine feste Karte. Dieser ist dynamisch – die Spanne erweitert sich, während sich der Preis entwickelt, und die Levels spiegeln immer die tatsächliche Spanne von Ihrem gewählten Anker bis zur aktuellen Kerze wider.
Die meisten Fibonacci-Implementierungen erfordern eine manuelle Richtungsfestlegung. Dieser liest bullischen und bärischen Kontext automatisch und richtet alle Levels entsprechend aus – ohne Parameteränderungen durch den Trader.
Die meisten Kanalwerkzeuge bieten ein Layout. Dieses bietet sieben verschiedene Modi, von einer sauberen Begrenzungsansicht bis zu einem vollständigen Fibonacci-Gitter, das auf die gesamte Spanne oder jede Hälfte unabhängig angewendet wird. Der Chart zeigt genau das Detailniveau, das Sie für den analysierten Kontext benötigen.
Mehrere Instanzen können gleichzeitig mit unabhängigen Ankern laufen – jede verfolgt ein anderes strukturelles Segment, ohne sich gegenseitig zu stören.
---
VERSTÄNDNIS DER FIBONACCI-STRUKTUR
Fibonacci-Verhältnisse sind nicht vorhersagend. Sie beschreiben proportionale Beziehungen innerhalb von Preisspannen – Beziehungen, die Trader seit Jahrzehnten über Märkte und Zeitrahmen hinweg wiederholt beobachten. Ob dies mathematische Eigenschaften von Märkten widerspiegelt oder einfach kollektives Verhalten um bekannte Levels ist, ist eine offene Frage. Für die praktische Anwendung ist das Wesentliche jedoch klarer.
Ein Fibonacci-Kanal definiert die Spanne einer Bewegung und teilt sie in proportional bedeutungsvolle Zonen ein. Trader nutzen diese Zonen, um zu beurteilen, ob ein Rücksetzer flach oder tief ist, ob ein Retracement hält oder scheitert und ob der Preis sich einem Bereich nähert, in dem die Struktur historisch bedeutsam war.
Der Wert eines ankerbasierten Ansatzes liegt darin, die Analyse auf ein spezifisches strukturelles Ereignis zu gründen. Der Kanal beginnt nicht an einem willkürlichen Punkt – er beginnt dort, wo Sie entscheiden, dass die relevante Bewegung startete. Diese Entscheidung treffen Sie basierend auf Ihrer Chartanalyse. Die Rolle des Indikators ist es, die Karte von diesem Punkt an genau zu pflegen, sodass die Levels gültig bleiben, solange die gemessene Struktur intakt ist.
---
Trading beinhaltet Risiken. Dieser Indikator ist ein Werkzeug der technischen Analyse – wenden Sie stets ein angemessenes Risikomanagement an.
Zusammenfassung
Kundenbewertungen
5 | 100 % | |
4 | 0 % | |
3 | 0 % | |
2 | 0 % | |
1 | 0 % |


![„Gaussian Channel [Iridio Capital]“-Logo](https://cdn.ctrader.com/image/webp/7c039209-5573-4a54-a072-f9528b503103_41960)


