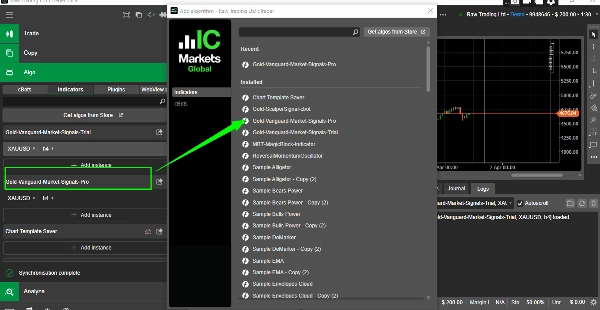
Beschreibung
Mein Affiliate-Link Impact/cTrader https://ctraderltd.pxf.io/c/7067705/3835381/43990
EXKLUSIVER PREISRABATT - BEGRENZTE VERFÜGBARKEIT
Professioneller XAUUSD Marktregime-Indikator jetzt zu erschwinglichen Preisen. Dieselbe Multi-Timeframe-Analyse, dasselbe umfassende Dashboard, besserer Zugang für ernsthafte Goldhändler.
GOLD-VANGUARD-MARKET-SIGNALS-PRO
Professioneller XAUUSD Marktregime- & Bias-Indikator
Teil der SAL-FAMILY-EXCLUSIVE Serie
Ein spezialisierter Multi-Timeframe XAUUSD Markt-Bias-Indikator, der EMA-Ausrichtung, Steigungsanalyse, ADX-Stärke, ATR-Regime und Bollinger-Kompressionslogik kombiniert. Klassifiziert Goldmarktbedingungen in drei praktische Ausgaben: NUR KAUFEN, NUR VERKAUFEN oder BEIDES/BEREICH - hilft Händlern, blindes Trading in ungünstigen Marktregimen zu vermeiden.
VERTRAUENSSIGNALE
- 4,0/5 Bewertung (3 verifizierte Bewertungen)
- 100 % 4-Sterne-Bewertungen
- Verifizierter Verkäufer (Sumsub)
- Speziell für XAUUSD/Gold
- Multi-Timeframe-Analyse (H1, H4, D1, W1)
- Testversion verfügbar
- Teil der SAL-FAMILY-EXCLUSIVE Serie
INDIKATOR-PROFIL (Verifiziert von cTrader)
Indikator-Kategorie: Trend
Ausgabetyp: Visualisierung
Datenanforderungen: Tick-Daten
Unterstützte Signale: Trendstärke, Volatilität
WAS VERIFIZIERTE KUNDEN SAGEN (4,0/5 BEWERTUNG)
4 Sterne - DeltaNeutral99 (17. April 2026):
"Ziemlich nützlich, wenn man schon Regeln hat. Wenn man erwartet, dass es magisch Einstiege druckt, wird man wahrscheinlich enttäuscht sein. Die erste Vorwärtsprüfung fühlt sich sauberer an, wenn die Handelsgröße klein bleibt."
4 Sterne - MartingaleMind (14. April 2026):
"Ziemlich gut als Helfer. Nicht perfekt, aber es machte das Gold-Trading leichter verständlich und eine Demo-Phase sollte für ein paar weitere Sitzungen ausreichen. Eine Nachprüfung in einem Monat."
4 Sterne - GridBotCommander (10. April 2026):
"Ehrlich gesagt macht dieser Sinn, wenn man nicht versucht, jedes Signal blind zu handeln. Erst auf Demo testen und sehen, wie es sich verhält, wenn die XAUUSD-Volatilität unübersichtlich wird. Wichtig ist zu beobachten, ob schlechte Trades zu schnell gehäuft auftreten."
WAS DIESER INDIKATOR TUT
Analysiert die XAUUSD Marktstruktur über die Zeitrahmen H1, H4, D1 und W1, um die aktuellen Bedingungen in drei klare Ausgaben zu klassifizieren:
- NUR KAUFEN: Starke bullische Ausrichtung auf höheren Zeitrahmen
- NUR VERKAUFEN: Starke bärische Ausrichtung auf höheren Zeitrahmen
- BEIDES/BEREICH: Gemischte, schwache oder komprimierende Bedingungen
Statt als einfacher Einstiegstrigger zu fungieren, ist dies ein höherstufiges Marktführungswerkzeug, das Händlern hilft zu verstehen, ob die Bedingungen eine bullische Fortsetzung, bärische Fortsetzung oder gemischtes/seitwärts gerichtetes Verhalten begünstigen.
WIE ES FUNKTIONIERT
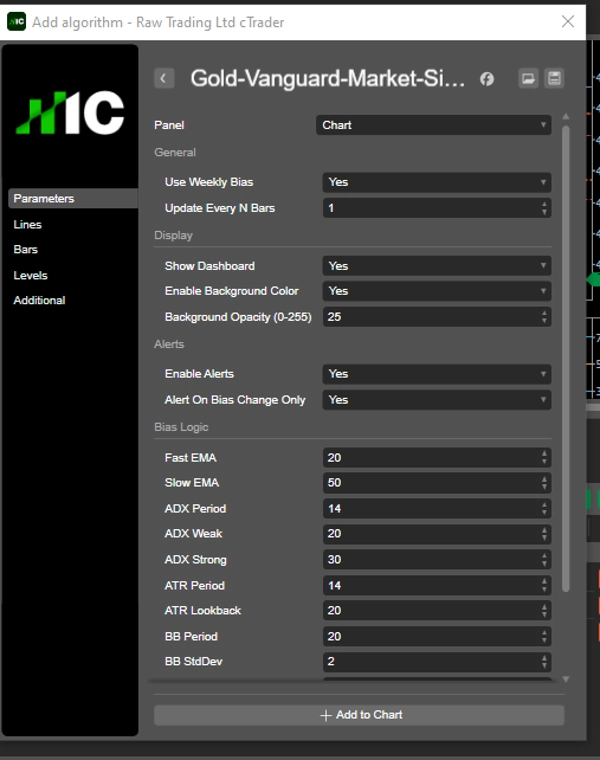
Verwendet ein gewichtetes Bewertungssystem über die Zeitrahmen H1, H4, D1, W1 und bewertet: EMA-Ausrichtung, EMA-Steigung, ADX-Trendstärke, ATR-Ausdehnung/-Kontraktion, Bollinger-Band-Kompression und Übereinstimmung/Konflikt zwischen Zeitrahmen. Dies schätzt nicht nur die Richtung, sondern auch, ob der Markt trendet, schwächer wird, komprimiert oder rotiert.
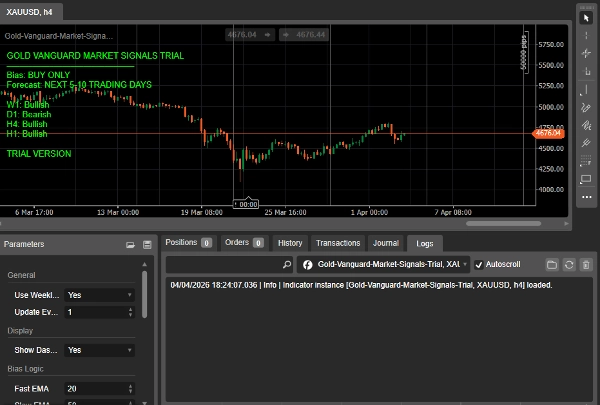
HAUPTAUSGABEN - DASHBOARD-ANZEIGEN
- Aktueller Marktbias (NUR KAUFEN / NUR VERKAUFEN / BEIDES-BEREICH)
- Vertrauensprozentsatz
- Prognosehorizont
- W1 Trendzustand
- D1 Trendzustand
- H4 Trendzustand
- H1 Trendzustand
- Kompressionsstatus
- ATR-Ausdehnungsstatus
- Zusammenfassung der Gründe
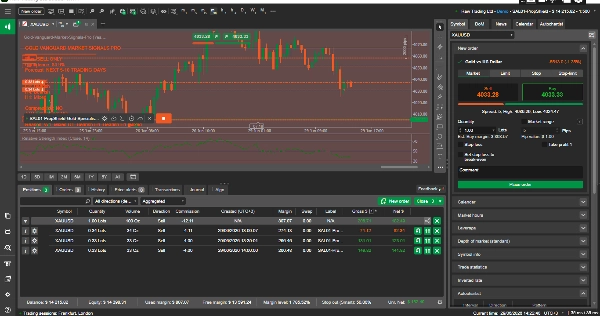
VISUELLES DESIGN
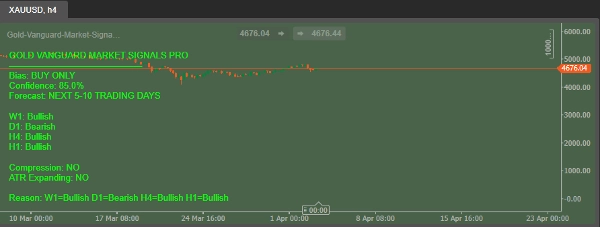
Vollständiges On-Chart-Dashboard mit optionalem Hintergrundfarbmodus (Grün = bullischer Bias, Rot = bärischer Bias, Gold = gemischt/Bereich) und optionalen Alarmen bei Bias-Änderung. Entwickelt für schnelle visuelle Interpretation des aktuellen Goldmarkt-Zustands.
PRO VERSION FUNKTIONEN
Vertrauensprozentsatz, vollständige Dashboard-Details, Hintergrundfarbmodus, Bias-Änderungsalarme, vollständige Regime- und Grundzusammenfassung, erweiterte Anzeige, vollständige Anpassungsoptionen.
EMPFOHLENE ANWENDUNG
Kann an jeden Chart-Zeitrahmen angehängt werden, aber die interne Logik basiert auf höherem Zeitrahmen. Empfohlene Chart-Zeitrahmen für beste Interpretation: H4 und H1. Nicht als Low-Timeframe-Scalping-Signalindikator konzipiert.
FÜR WEN IST DAS GEEIGNET
Manuelle XAUUSD-Händler, Swing-Trader, Intraday-Trader, die Bias auf höheren Zeitrahmen nutzen, Analysten, cBot-Nutzer, die einen Richtungsfilter wollen, Systementwickler, die an Goldstrategien arbeiten, und Händler, die blindes Trading in falschen Marktregimen vermeiden möchten.
PRAKTISCHE VORTEILE
- Filtert Long-Trades während bärischer Bedingungen
- Filtert Short-Trades während bullischer Bedingungen
- Identifiziert klar gemischte/seitwärts gerichtete Perioden
- Erkennt Übergangsphasen zwischen Trend und Bereich
- Kombiniert höherzeitige Struktur mit Ihrer Einstiegsmethode
- Reduziert emotionale Entscheidungen durch strukturiertes Framework
.
WAS IST ENTHALTEN
Vollständiger Gold-Vanguard-Market-Signals-Pro Indikator, Multi-Timeframe Analyse-Engine, vollständige Dashboard-Anzeige, anpassbare Parameter, Einrichtungshilfe, lebenslange Updates, priorisierter Entwickler-Support, kostenlose zukünftige Upgrades, direkte Entwickler-Kommunikation, aktiver Diskussionskanal-Support.
EINSTIEG ZUR SAL-FAMILY-EXCLUSIVE
Dieser Indikator ist Ihr Zugang zum kompletten SAL-FAMILY Trading-Ökosystem. Entdecken Sie unsere Premium-cBots:
Top Performer: SAL-V03-Gold-CMA-Pro - Nr. 1 Rang, +256 % Live-ROI
Prop Firm: SAL01-PropShield-Gold-Specialist-Pro
Konservatives Grid: SafeGrid-Gold-Vanguard-Pro - +48 % ROI
Dual-Direktional Gold: Gold-Compression-Surge-Pro - +43 % ROI
Mean Reversion Forex: Axiom-Reversion-Pro
Mean Reversion Gold: SAL-V03-Gold-Reversion-Pro
Optimierter Trend: SAL-02-Max-CMA-Gold-250-Full-Optimized
Aggressives Gold: SAL-04-GOLD-TF-ULTRARISK-PRO
JPY Volatilität: V5-VOLATILITY-PAIRS-FX-FUSION-PRO
Begleitindikator: HeikinAshi-Supertrend-Scanner-Pro
Besuchen Sie das Verkäuferprofil SAL-FAMILY-EXCLUSIVE für die komplette Produktpalette.
FAQ
Was zeigt der Indikator an?
Klassifiziert den XAUUSD-Markt in NUR KAUFEN, NUR VERKAUFEN oder BEIDES/BEREICH plus Vertrauensprozentsatz, Prognosehorizont, W1/D1/H4/H1 Trendzustände, Kompressionsstatus, ATR-Ausdehnungsstatus und Grundzusammenfassung.
Für welches Symbol ist er konzipiert?
Speziell für XAUUSD (Gold).
Funktioniert er auf jedem Zeitrahmen?
Ja, aber empfohlene Chart-Zeitrahmen für die Interpretation sind H4 und H1, da die interne Logik auf höherem Zeitrahmen basiert.
Ist es ein Einstiegssignalindikator?
Nein. Es ist ein Markt-Bias- und Regime-Indikator, kein direkter Einstiegstrigger.
Welche Zeitrahmen analysiert er intern?
H1, H4, D1 und W1.
Was bedeutet der Vertrauensprozentsatz?
Reflektiert die relative Stärke der internen Multi-Timeframe-Richtungsbewertung, um abzuschätzen, wie stark die aktuellen Bedingungen den angezeigten Bias unterstützen.
Was bedeutet der Prognosehorizont?
Geschätztes kurzfristiges Bias-Fenster basierend auf aktueller Marktstruktur und Ausrichtungsstärke. Keine Garantie.
Kann ich ihn mit meiner eigenen Strategie verwenden?
Ja. Entwickelt als universelles Goldmarkt-Bias-Werkzeug, kompatibel mit manuellem Trading, anderen Indikatoren oder automatisierten Systemen.
Garantiert er die zukünftige Richtung?
Nein. Schätzt aktuellen und kurzfristigen Bias nur anhand technischer Struktur.
Was ist der Unterschied zwischen Trial und Pro?
Trial ist auf EURUSD M1 mit Basisfunktionen beschränkt. Pro bietet Vertrauensprozentsatz, vollständiges Dashboard, Hintergrundfarbmodus, Bias-Änderungsalarme, erweiterte Regime-Zusammenfassung, erweiterte Anpassung.
ENTWICKLERHINWEIS
Gold-Vanguard-Market-Signals-Pro kombiniert EMA-Struktur, Trendstärke, Volatilitätsregime und Kompressionsanalyse in einem klaren visuellen Dashboard mit optionalen Alarmen, Hintergrundfarbmodus, Vertrauensbewertung und höherzeitlichem Kontext. Es bietet eine praktische, professionelle Möglichkeit, die Richtungswahrnehmung im Goldhandel zu verbessern.
Wenn Sie ein klareres Verständnis dafür wollen, ob Gold aktuell Kauf, Verkauf oder Abwarten bevorzugt, ist dieser Indikator genau dafür konzipiert.
WICHTIGER HINWEIS
Dies ist ein Marktführungswerkzeug, keine Gewinn-Garantie. Es schätzt aktuellen Markt-Bias und wahrscheinliches kurzfristiges Regime anhand technischer Strukturanalyse. Es sagt keine geopolitischen Ereignisse, makroökonomische Überraschungen oder Ausführungsanomalien voraus.
RISIKOHINWEIS
Dieser Indikator ist nur ein Marktanalysewerkzeug. Trading beinhaltet ein erhebliches Verlustrisiko. Vergangene Leistungen garantieren keine zukünftigen Ergebnisse. Nutzer sind verantwortlich für ihre eigenen Handelsentscheidungen, Risikomanagement, Positionsgrößen und Strategieausführung.
SCHLÜSSELWÖRTER
cTrader Indikator, Gold Indikator, XAUUSD Indikator, Multi-Timeframe Indikator, Marktregime-Werkzeug, Trend-Bias-Indikator, EMA ADX Indikator, Bollinger Bänder, ATR Indikator, Volatilitätsindikator, Goldmarkt-Analyse, H4 H1 D1 W1 Analyse, Trendstärke-Indikator, Kompressionsindikator, Konfluenzindikator, Trading-Dashboard, SAL-FAMILY-EXCLUSIVE.
Handeln Sie klug. Handeln Sie informiert. Handeln Sie verantwortungsbewusst.
Salieh - SAL-FAMILY-EXCLUSIVE Serie
Zusammenfassung
The on-chart dashboard visually displays current market bias with optional background color coding (green for bullish, red for bearish, gold for mixed/range), confidence percentage, forecast horizon, individual timeframe trend states, compression and ATR expansion status, and a reason summary. Alerts on bias changes and full customization options are included in the Pro version.
Recommended for manual XAUUSD traders, swing and intraday traders using higher-timeframe bias, system developers, and cBot users, this tool helps filter trades according to prevailing market regimes, identify ranging periods, and reduce emotional decision-making. It supports tick data input and outputs trend strength and volatility signals. The indicator is part of the SAL-FAMILY-EXCLUSIVE series and includes lifetime updates and developer support.
Kundenbewertungen
5 | 0 % | |
4 | 100 % | |
3 | 0 % | |
2 | 0 % | |
1 | 0 % |