
Beschreibung
Wenn man sich den vollständigen Indikator ansieht, lasse mich sowohl die Kurzbeschreibung als auch die vollständige Store-Beschreibung schreiben.
Kurzbeschreibung (120 Zeichen)
HTF Bias Detector: Panel-Kerzen, CRT/Expansion/Schwungpunkt-Muster, PSP & SMT Divergenz – alles in einem Overlay.
Vollständige cTrader Store-Beschreibung
HTF Bias Detector – Panel Edition
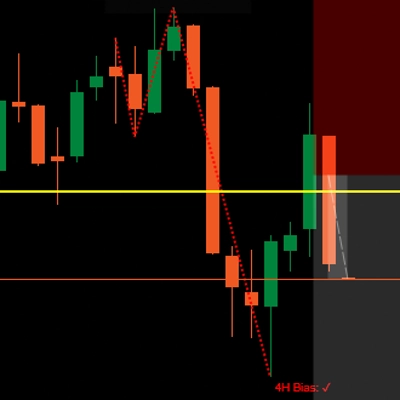
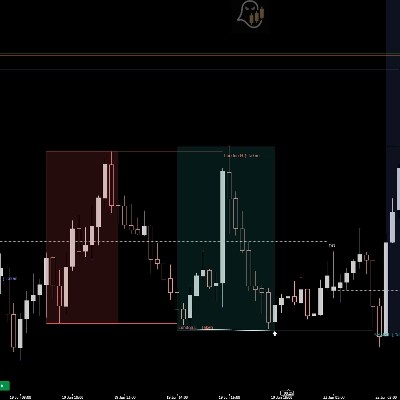
HTF Bias Detector bringt Ihren gesamten Top-Down-Analyse-Workflow in einen einzigen Overlay-Indikator. Anstatt zwischen Zeitrahmen zu wechseln, zeichnet er ein schwebendes Panel mit Höheren Zeitrahmen (HTF) Kerzen direkt rechts neben dem Preis in Ihrem aktuellen Chart und erkennt automatisch Ihre wichtigsten Bias-Muster, korrelierte Paar-Divergenzen und Smart Money Technique-Signale – alles ohne den Bildschirm zu verlassen.
Wie das Panel funktioniert
Der Indikator bestimmt automatisch den korrekten HTF basierend auf dem Chart, auf dem Sie sich befinden, und folgt dabei der standardmäßigen Zeitrahmen-Ausrichtung, die im institutionellen und Smart Money Trading verwendet wird:
Ihr ChartHTF-Panel
1M / 2M / 3M / 4M - 15M
5M / 10M - 1H
15M / 30M - 4H
1H - Täglich
4H - Wöchentlich
Täglich - Monatlich
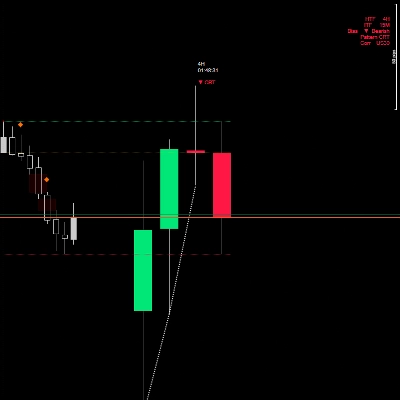
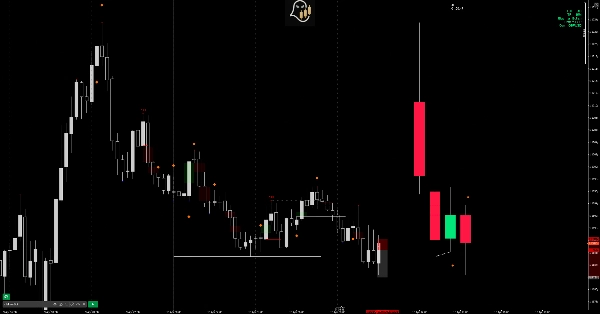
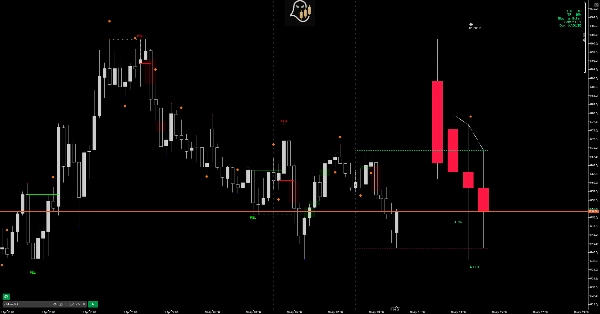
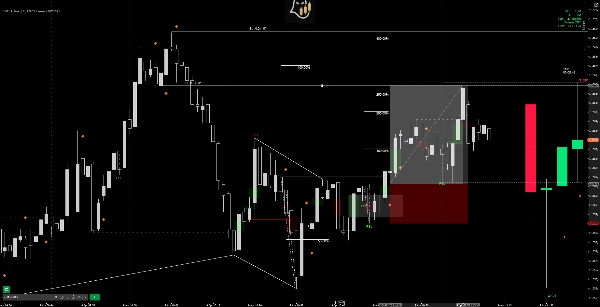
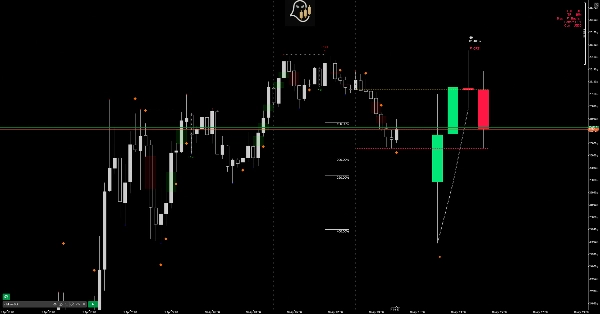
Das Panel zeichnet N konfigurierbare HTF-Kerzen (Standard 6) rechts vom letzten Balken, komplett mit einem Hintergrundfeld, Dochten, die auf jedem Kerzenkörper zentriert sind, und vertikalen gepunkteten Trennern auf dem Live-Chart, die jede HTF-Eröffnung markieren. Ein Countdown-Timer über dem Panel zeigt die verbleibende Zeit der aktuellen HTF-Kerze an, und gestrichelte OHLC-Projektionslinien erstrecken sich von der sich bildenden HTF-Kerze zurück zum Live-Preisbereich, sodass Sie immer wissen, wo sich die aktuelle HTF-Eröffnung, das Hoch, das Tief und der Schlusskurs befinden.
Bias-Mustererkennung
Der Indikator scannt die sichtbaren HTF-Panel-Kerzen nach drei Kerninstitutionellen Bias-Mustern und kennzeichnet jedes erkannte Signal direkt im Panel:
CRT — Candle Range Theory Gebildet von zwei Kerzen. C1 setzt die Range. C2 wischt das Tief von C1 (bullisch) oder das Hoch von C1 (bärisch), schließt aber wieder innerhalb der Range, ohne das gegenüberliegende Extrem zu erreichen. Signalisiert eine Liquiditätsaufnahme und Expansion in die entgegengesetzte Richtung. C3 und C4 sind die erwarteten Expansionskerzen.
Expansion Gebildet von zwei Kerzen. C2 wischt das Tief von C1 und schließt dann über dem Hoch von C1 (bullisch) oder wischt das Hoch von C1 und schließt unter dem Tief von C1 (bärisch). Eine Ein-Kerzen-Vollbereichs-Expansion, die überwältigenden Richtungsdruck zeigt. C3 und C4 sind erwartete Fortsetzungskerzen.
Swing Point (geschützt) Gebildet von drei Kerzen. C1 setzt die Richtung. C2 durchbricht und schließt jenseits des Extrems von C1 – fängt Ausbruchshändler ein. C3 erobert die Range von C2 vollständig zurück, indem es über dem Eröffnungswert von C2 (bullisch) oder unter dem Eröffnungswert von C2 (bärisch) schließt, schützt den Schwung und signalisiert eine Umkehr. C4 ist die erwartete Fortsetzung.
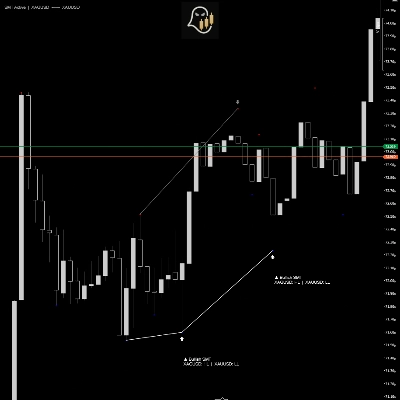
Jedes erkannte Muster wird mit einem Richtungspfeil und dem Musternamen direkt auf der Signalkerze im Panel beschriftet (z. B. ▲ CRT, ▼ Expansion, ▲ Swing Point). Das Farbzuordnungssystem stellt sicher, dass bei Überlappungen mehrerer Muster auf denselben Kerzen immer das neueste Muster gewinnt – wodurch verhindert wird, dass veraltete Farben früherer Signale neuere verfälschen.
PSP — Precision Swing Point
PSP wird auf zwei Ebenen gleichzeitig erkannt:
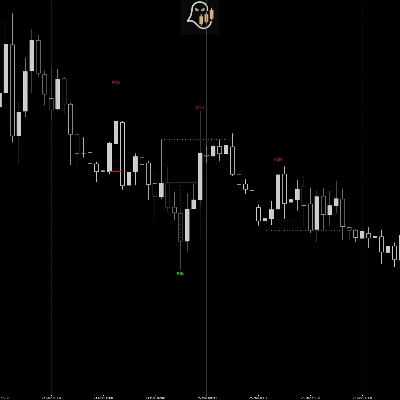
HTF Panel PSP — vergleicht jede HTF-Panel-Kerze Ihres Chart-Symbols mit der entsprechenden Kerze des korrelierten Paares im gleichen Zeitrahmen. Wenn die beiden Paare in entgegengesetzte Richtungen auf derselben HTF-Kerze schließen, erscheint ein orangefarbener ◆ Diamant über oder unter dieser Panel-Kerze, leicht versetzt neben dem Musterlabel, sodass beide Signale lesbar bleiben, ohne sich zu überlappen.
ITF Chart PSP — scannt die letzten 200 Balken des aktuellen Chart-Zeitrahmens und platziert ein orangefarbenes ◆ Diamant-Symbol direkt auf jedem Balken, bei dem Ihr Symbol und sein korreliertes Paar in entgegengesetzte Richtungen geschlossen haben. Ein konfigurierbarer Doji-Filter (Standard 10 % Körper-zu-Range-Verhältnis) verhindert, dass schwache Unentschlossenheitskerzen falsche PSP-Signale erzeugen.
SMT — Smart Money Technique Divergenz
SMT-Divergenz wird auf zwei Ebenen erkannt:
HTF Panel SMT — vergleicht aufeinanderfolgende HTF-Panel-Kerzenhochs und -tiefs zwischen Ihrem Chart-Symbol (Paar A) und dem korrelierten Paar (Paar B). Wenn Paar A ein tieferes Tief macht, während Paar B ein höheres Tief macht (bullische SMT), oder Paar A ein höheres Hoch macht, während Paar B ein niedrigeres Hoch macht (bärische SMT), werden zwei Linien direkt im Panel gezeichnet, die die divergierenden Preisniveaus verbinden.
Der Linienstil kommuniziert, welche Seite der Divergenz Ihr aktueller Chart repräsentiert: Eine durchgezogene Linie markiert die gefegte/falsche Seite, und eine gepunktete Linie markiert die starke/geschützte Seite. Da die Erkennung symmetrisch ist, erscheint das Signal gleichzeitig auf den GBPUSD- und EURUSD-Charts (zum Beispiel) – wobei sich die durchgezogenen und gepunkteten Linien je nach angesehenem Paar tauschen.
Automatische Erkennung korrelierter Paare
Der Indikator ermittelt automatisch das korrelierte Paar aus dem Chart-Symbol mithilfe einer umfassenden Paar-Karte, die Forex-Majors, Metalle, Indizes und Krypto abdeckt. Für die Paare, die Sie am meisten handeln, ist keine manuelle Konfiguration erforderlich:
Symbol Auto-Paar
GBPUSD-EURUSD
AUDUSD-NZDUSD
GBPJPY-EURJPY
XAUUSD-XAGUSD
NAS100-US30
US500-NAS100
BTCUSD-ETHUSD
Der Resolver normalisiert Symbolnamen (entfernt Trennzeichen wie /, -, _) und entfernt gängige Broker-Suffixe (z. B. GBPUSDm, GBPUSD.r, GBPUSD_SB) vor der Suche. Ein Parameter für manuelle Symbolüberschreibung ermöglicht es Ihnen, ein beliebiges benutzerdefiniertes korreliertes Paar anzugeben, und ein Auto-Detect-Schalter lässt Sie die automatische Erkennung vollständig deaktivieren.
Dashboard
Ein kompaktes Eck-Dashboard (konfigurierbar für jede Ecke) zeigt:
- HTF — den Zeitrahmen der Panel-Kerzen
- ITF — Ihren aktuellen Chart-Zeitrahmen
- Bias — ▲ Bullisch / ▼ Bärisch / ── Neutral basierend auf dem zuletzt erkannten Muster
- Muster — der spezifische Mustername (CRT, Expansion, Swing Point, PSP)
- Corr — das ermittelte korrelierte Symbol
Die Textfarbe des Dashboards entspricht der Bias-Richtung – grün für bullisch, rot für bärisch, grau für neutral.
Sicheres Zeichnen – Ihre Linien werden niemals gelöscht
Alle Indikatorobjekte verwenden dedizierte interne Präfixe. Nur die eigenen Objekte des Indikators werden bei jedem Neuzeichnen entfernt. Ihre manuell gezeichneten Trendlinien, Rechtecke, Fibonacci-Level und alle anderen Zeichenwerkzeuge bleiben vollständig unberührt.
Parametergruppen
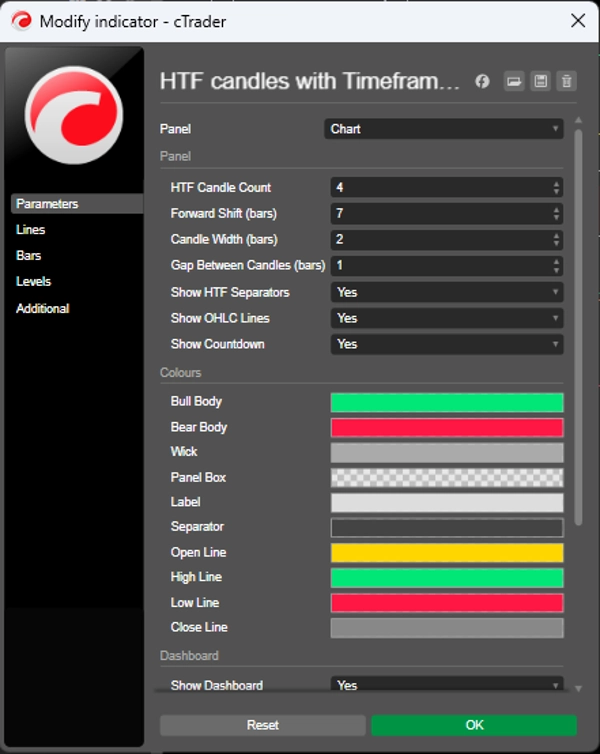
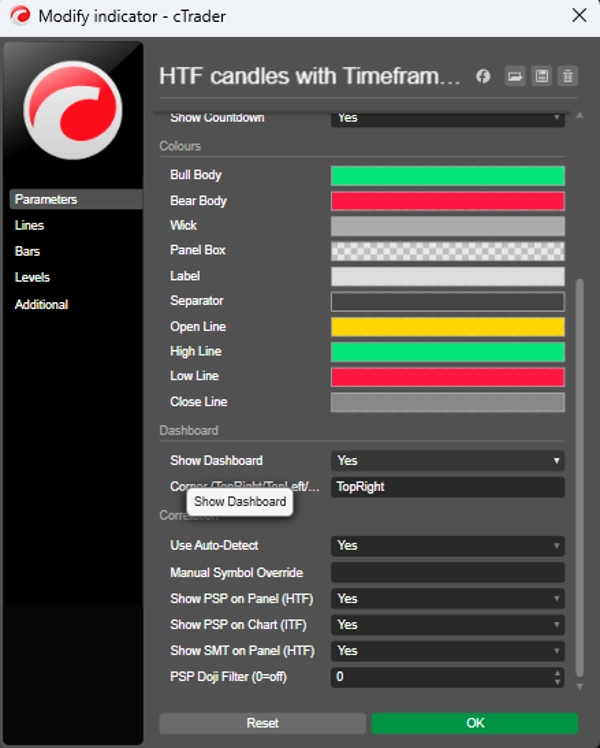
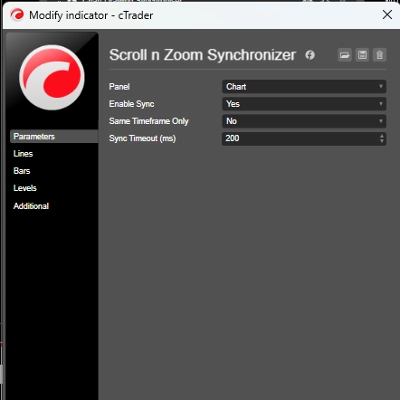
Panel — Kerzenanzahl, Vorwärtsverschiebung, Kerzenbreite, Abstand, Trenner, OHLC-Linien, Countdown-Timer
Farben — Bullen-Körper, Bären-Körper, Docht, Panel-Box, Label, Trenner, Farben der Open/High/Low/Close-Linien
Dashboard — Anzeige-Schalter, Eckposition
Korrelation — Auto-Detect-Schalter, manuelle Symbolüberschreibung, PSP-Panel-Schalter, PSP-Chart-Schalter, HTF-SMT-Schalter, PSP-Doji-Filter
ITF SMT — Anzeige-Schalter, Swing-Rückblick, minimale Balken zwischen Swings, bärische/bullische Schalter, Linienstärke, Label-Schalter















![„Gaussian Channel [Iridio Capital]“-Logo](https://cdn.ctrader.com/image/webp/2c4f9ca9-4e9b-476d-b5a6-787c8095032b_61546)
