present
Registrieren Sie sich und erhalten Sie $50 Rabatt auf Ihren ersten Kauf
Trading product for CycleFrecuencyProV1 Indikator RSI Order Block, image 1
CycleFrecuencyProV1
Indikator
Version 1.0, May 2026
Windows, Mac
5.0
Bewertungen: 2
Trading product for CycleFrecuencyProV1 Indikator RSI Order Block, image 2
Trading product for CycleFrecuencyProV1 Indikator RSI Order Block, image 3
Trading product for CycleFrecuencyProV1 Indikator RSI Order Block, image 4
Trading product for CycleFrecuencyProV1 Indikator RSI Order Block, image 5
Trading product for CycleFrecuencyProV1 Indikator RSI Order Block, image 6
Trading product for CycleFrecuencyProV1 Indikator RSI Order Block, image 7
Seit 18/12/2025

Beschreibung

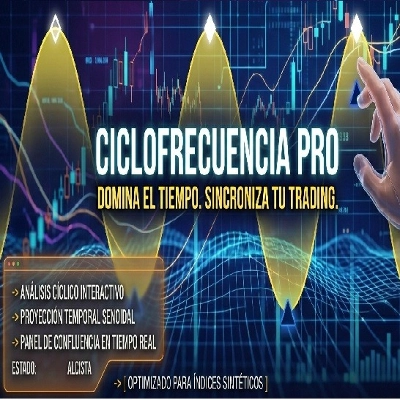
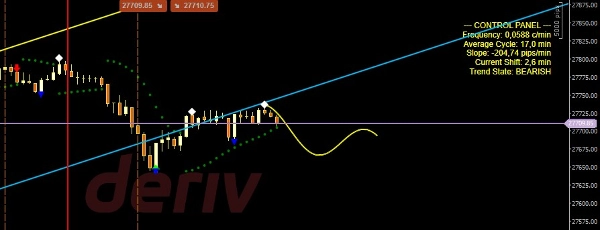
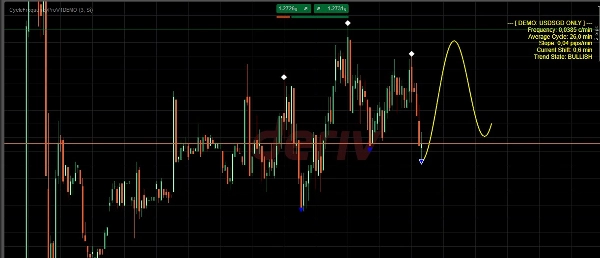
Synchronisieren Sie Ihren Handel mit der Marktfrequenz Müde von verzögerten Indikatoren? Die meisten Trader scheitern, weil sie die zeitliche Dimension des Marktes ignorieren. Cycle Frequency Pro V1 verändert das Spiel, indem es Ihnen ermöglicht, die zukünftige Kursentwicklung basierend auf historischen Zyklen und Echtzeit-Frequenzanalyse zu projizieren.

Was macht diesen Indikator einzigartig? Während automatisierte Algorithmen bei Volatilität oft versagen, gibt Ihnen Cycle Frequency Pro die Kontrolle. Durch manuelle Identifikation wichtiger struktureller Hoch- und Tiefpunkte liefern Sie den „menschlichen Vorteil“, den der Indikator in ein präzises mathematisches Modell umwandelt. Er berechnet sofort Frequenz, Steigung und Phasenverschiebungen, um die nächste Welle mit hoher Wahrscheinlichkeit zu visualisieren.

Hauptmerkmale:

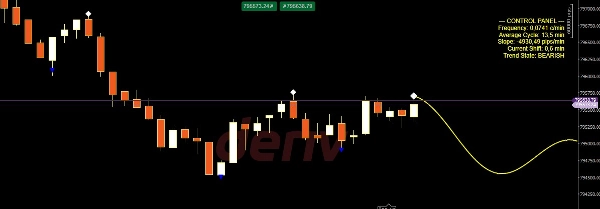
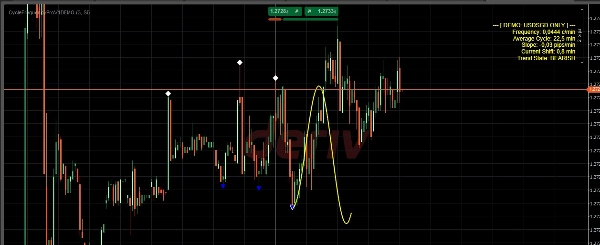
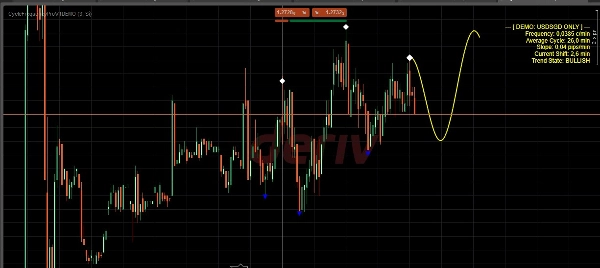
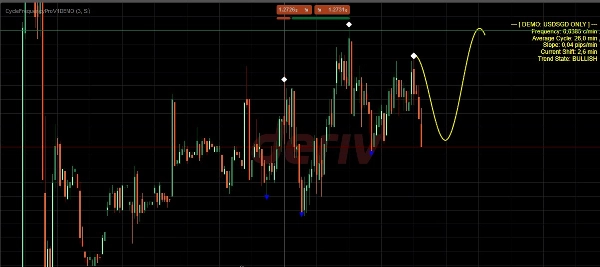
  • Dynamische Sinuswellen-Projektion: Visualisieren Sie die wahrscheinlichste Kursentwicklung entlang der Zeitachse.
  • Professionelles Bedienfeld: Echtzeitdaten einschließlich Frequenz (c/min), Durchschnittlicher Zyklus und Pip-Steigung.
  • Präziser geometrischer Motor: Optimiert für ultra-glatte Darstellung und Genauigkeit der Scheitelpunkte.
  • Marktübergreifende Vielseitigkeit: Speziell entwickelt für die 24/7-Flüssigkeit von Synthetic Indices, bei gleichzeitiger Spitzenleistung in Forex, Rohstoffen und Metallen.

Schnellstart:

  1. Richten Sie die Diamanten (Hochpunkte) und Dreiecke (Tiefpunkte) an den aktuellsten strukturellen Wendepunkten aus.
  2. Die Welle synchronisiert sich automatisch mit der Kurssteigung und dem Rhythmus.
  3. Führen Sie Trades aus, wenn die projizierte Welle mit Ihren institutionellen Zonen übereinstimmt.

Zusammenfassung

KI-Zusammenfassung
CycleFrecuencyProV1 is a market timing indicator designed to forecast price rhythms using an interactive sine wave projection based on historical cycles and real-time frequency analysis. It enables traders to manually mark key structural peaks and valleys, which the indicator then uses to calculate frequency, slope, and phase shifts, projecting the most probable future price trajectory.

Key features include a dynamic sine wave visualization aligned with the time axis, a professional control panel displaying real-time metrics such as frequency (cycles per minute), average cycle length, and pip slope, and a precision geometric engine optimized for smooth rendering and accurate vertex placement. The indicator is engineered for versatility across multiple markets, including Synthetic Indices with 24/7 trading, Forex, Commodities, and Metals.

To use, traders align the indicator’s markers with recent structural turning points, allowing the wave to synchronize automatically with current price rhythm. This projection can then be used to identify high-probability trade entries in conjunction with institutional zones. The indicator supports visualization, signal generation for reversals, level touches, trend strength, and divergence, and requires bar or tick data for analysis. It is categorized under market structure indicators.
Indikatorprofil
Indikatorkategorie
Marktstruktur (SMC)
Ausgabetyp
Visualisierung
Signale
Filter
Datenanforderungen
Nur Balken
Tick-Daten
Unterstützte Signale
Wendepunkt
Level – Berührung
Trendstärke
Abweichung

Diskussion

Kundenbewertungen

5.0
Bewertungen: 2
5
100 %
4
0 %
3
0 %
2
0 %
1
0 %
Kundenbewertungen
May 19, 2026
May 8, 2026

Häufig gestellte Fragen (FAQ)

RSI
Order Block
Market Structure
Supply & Demand
Channel
Liquidity Grab
Support & Resistance
Über den cTrader Store verfügbare Produkte, einschließlich Handelsbots, Indikatoren und Plugins, werden von externen Entwicklern bereitgestellt und nur zu Informations- und technischen Zugriffszwecken verfügbar gemacht. cTrader Store ist kein Broker und erbringt keine Anlageberatung, persönlichen Empfehlungen oder eine Garantie für zukünftige Performance.

Mehr von diesem Autor

Indikator
Channel
Fibonacci
+5
Professional dynamic tunnel for cTrader. Accurate market structure and fractal confluence analysis for expert traders.

Das könnte Sie auch noch interessieren

Indikator
AI
ATR
+18
Scalping signals with EMA/RSI/ATR logic. Visual cloud shows precise entry and exit zones. Built for M1/M5 scalpers.
Indikator
ATR
SMC
+7
SMC indicator for cTrader detecting order blocks, fair value gaps, liquidity sweeps and market structure with buy/sell
Indikator
Supply & Demand
Premium/Discount
Advanced Dual KAMA indicator with automated multi-asset presets & target levels.
Indikator
AI
ATR
+9
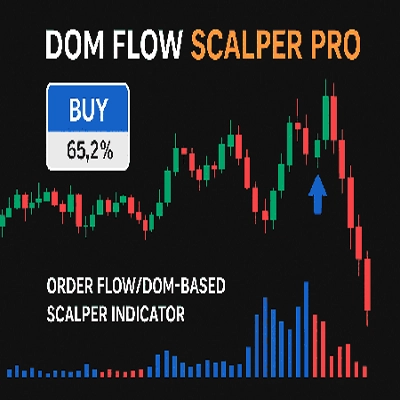
Scalp smarter with DOM Flow Scalper PRO – real-time Bid/Ask imbalance and volume precision!
Indikator
RSI
Breakout
+1
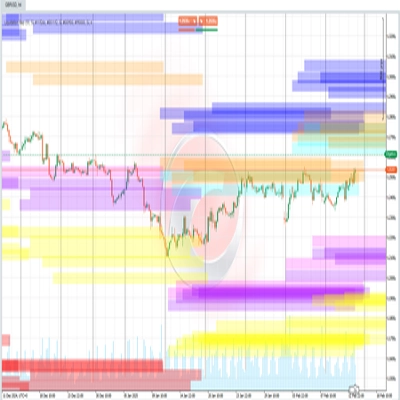
📊 Liquidation Map: Potential areas where highly leveraged investors might face liquidations.
Indikator
ATR
RSI
+1
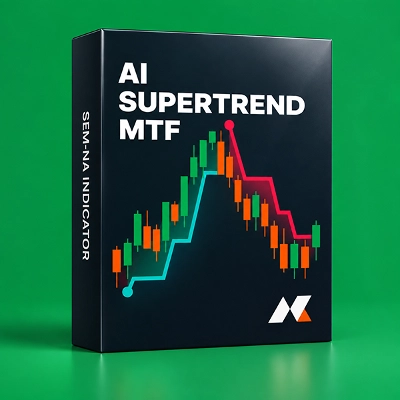
AI Supertrend MTF uses K-NN Machine Learning to eliminate lag. Features multi-timeframe projection & dynamic glowing clo
Indikator
Prop
ZigZag
+5
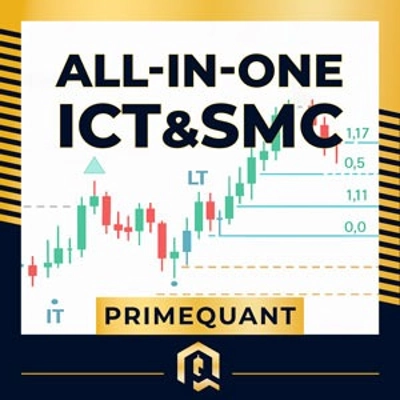
All-in-One ICT/SMC Institutional Framework — Ranges, Structure, Liquidity, Fibonacci & Time Engine.
Indikator
SMC
Prop
+5
ADVANCED ICT + ADR + AWR SUITE PRO (The Ultimate All-in-One Toolkit for Price Action Traders)
Indikator
Volume
Key Levels
+1
Tape Reading indicator ,book and flow analysis
Indikator
Key Levels
Trend-filtered signals, transparent trade plans and a multi-timeframe decision panel for cTrader.
Indikator
RSI
VWAP
+5
Trend direction, chart signals, reversal zones and volume tools in one configurable indicator.
Indikator
EMA
Forex
+5
ALMA Smoothed Gaussian Moving Average (ASGMA) – by LudwigICT
Indikator
Forex
EURUSD
+5
Smart Money Breakout Channels – Auto-detect breakout zones with price, volume & volatility insights on cTrader.
Indikator
Fibonacci
Key Levels
+1
Explore Elliott wave counts, three swing sizes and example levels with an interactive cTrader chart panel.
Indikator
ADX
ATR
+5
Designed exclusively for trading the Gold market (XAUUSD), GoldMasterIndicator provides institutional-grade technical!
Indikator
SMC
Forex
+5
MMXM Structure by LudwigICT – Professional Market Structure Mapping Tool
Indikator
SMC
Signal
+2
Gold Market Maker Zones; Non-repainting Supply & Demand detector for XAUUSD. Precise institutional zones for cTrader.
Indikator
Signal
New Trend whit buy-sell signal

Preis

Seit 18/12/2025