present
Registrieren Sie sich und erhalten Sie $50 Rabatt auf Ihren ersten Kauf
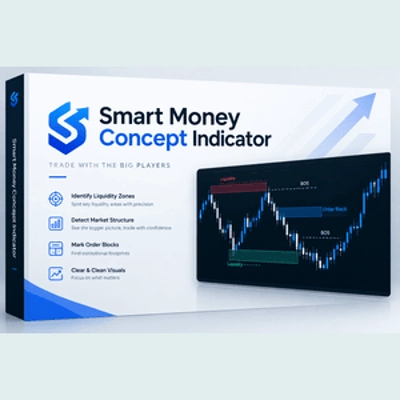
Trading product for Supply Demand Detector Indikator Supply & Demand, image 1
Supply Demand Detector
Indikator
5 downloads
Version 1.1, Oct 2026
Windows, Mac
Trading product for Supply Demand Detector Indikator Supply & Demand, image 2
Trading product for Supply Demand Detector Indikator Supply & Demand, image 3
Trading product for Supply Demand Detector Indikator Supply & Demand, image 4
Seit 13/05/2026
27
Kostenlose Installationen

Beschreibung

Wie der Supply & Demand Zone Detector funktioniert:

1. Impulserkennung (Erkennung institutioneller Aktivitäten)

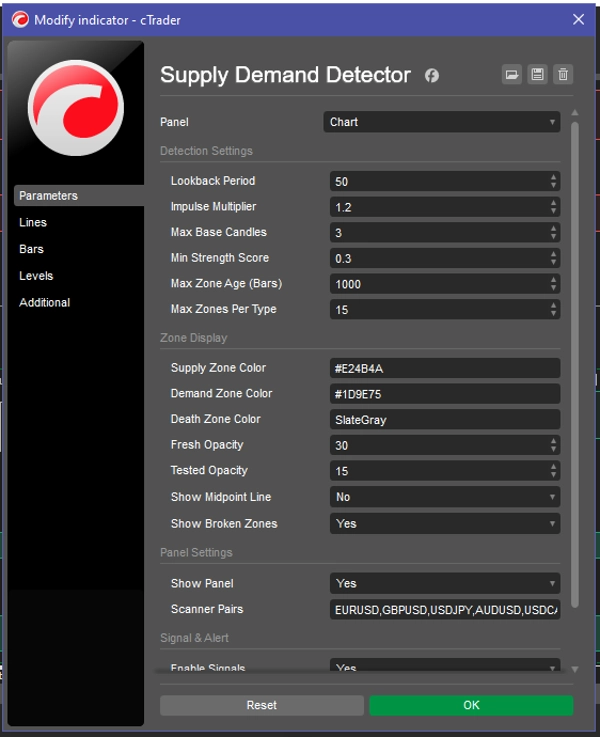
Der Algorithmus berechnet kontinuierlich die durchschnittliche Kerzengröße der letzten 50 Kerzen (anpassbar über Lookback Period). Wenn er eine Kerze erkennt, die deutlich größer als dieser Durchschnitt ist (gesteuert durch den Impulse Multiplier, Standard 1.2x), markiert er sie als Impulskerze.

  • Bullischer Impuls: Zeigt institutionellen Kauf an. Bildet eine Demand Zone.
  • Bärischer Impuls: Zeigt institutionellen Verkauf an. Bildet eine Supply Zone.

2. Basiserkennung (Zeichnen der Zone)

Sobald ein Impuls erkannt wird, sucht der Indikator rückwärts nach einem Cluster kleiner Kerzen (Körpergröße < 50 % des Durchschnitts), die dem Impuls unmittelbar vorausgehen. Dies sind die Basis-Kerzen.

  • Die Oberseite der Zone ist das höchste Hoch dieser Basis-Kerzen.
  • Die Unterseite der Zone ist das niedrigste Tief dieser Basis-Kerzen.

3. Stärke-Bewertung

Der Indikator berechnet eine Stärke-Bewertung (von 0.00 bis 1.00) basierend auf drei Faktoren:

  1. Impulsgröße: Wie massiv die Ausbruchskerze ist.
  2. Nachbewegung: Wie weit der Preis unmittelbar nach dem Ausbruch gereist ist.
  3. Basisdichte: Weniger Basis-Kerzen bedeuten eine schnellere, aggressivere institutionelle Reaktion (höhere Bewertung).
    Diese Bewertung wird am rechten Rand des Zonenfeldes angezeigt.

4. Zonenlebenszyklus & Der "Death"-Mechanismus

Während sich der Live-Preis bewegt, aktualisiert der Indikator den Status der Zonen in Echtzeit:

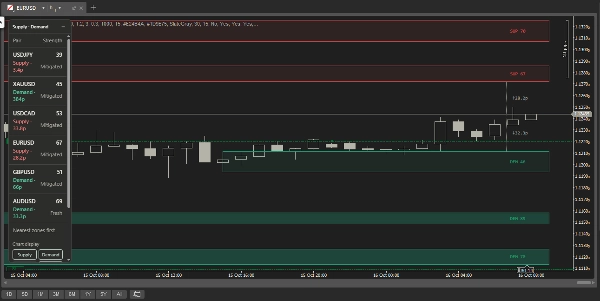
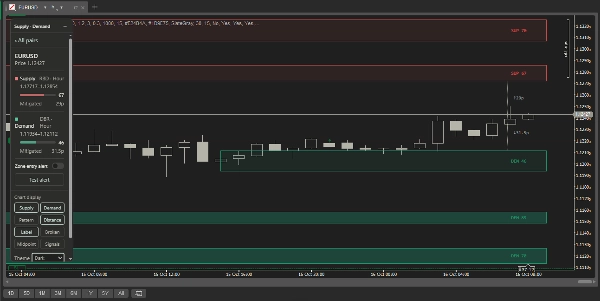
  • Frisch (Unberührt): Die Zone ist neu gebildet und sehr gültig. Das Feld dehnt sich automatisch nach rechts aus und folgt der aktuellen Live-Kerze.
  • Getestet: Der Preis berührt die Zone, durchbricht sie aber nicht. Erzeugt einen Signalpfeil (Kaufen/Verkaufen) im Chart.
  • Abgeschwächt: Der Preis dringt mehr als 50 % tief in die Zone ein. Die Zone schwächt sich ab.
  • Gebrochen (Death Zone): Wenn eine Kerze vollständig schließt jenseits der gegenüberliegenden Grenze der Zone (z. B. unterhalb einer Demand Zone schließt), wird die Zone ungültig.
    • Die visuelle Reaktion: Die Zone hört sofort auf, sich nach rechts auszudehnen (verankert am DeathTime), und ihre Farbe ändert sich zu einem verblassten Schiefergrau (Death Color), um zu zeigen, dass sie nicht mehr aktiv ist.

5. Multi-Overlap-Filter

Um zu verhindern, dass das Chart zu überladen wird, prüft der Indikator auf überlappende Zonen. Wenn eine neu erkannte Zone mehr als 70 % mit einer bestehenden älteren Zone desselben Typs überlappt, wird die neue Zone ignoriert.

Zusammenfassung

KI-Zusammenfassung
The Supply Demand Detector is a trading indicator designed to identify supply and demand zones by detecting institutional impulsive price moves. It operates by continuously calculating the average body size of recent candles and flags significantly larger candles as impulse candles, distinguishing between bullish impulses (demand zones) and bearish impulses (supply zones).

After detecting an impulse, the indicator identifies a cluster of smaller preceding candles called base candles, using their highest high and lowest low to define the zone boundaries. It assigns a strength score (0.00 to 1.00) to each zone based on impulse size, subsequent price movement, and base candle density, which is displayed on the chart.

The indicator tracks the lifecycle of zones in real-time, categorizing them as fresh, tested (with buy/sell signal arrows), mitigated, or broken (invalidated), with visual cues such as color changes and zone stretching adjustments. To reduce chart clutter, it filters out new zones that overlap more than 70% with existing zones of the same type.

This tool supports visualization of market structure through supply and demand zones, aiding traders in identifying potential reversal points based on institutional activity.
Indikatorprofil
Indikatorkategorie
Marktstruktur (SMC)
Ausgabetyp
Visualisierung
Datenanforderungen
Nur Balken
Unterstützte Signale
Wendepunkt

Diskussion

Kundenbewertungen

0.0
Bewertungen: 0
Kundenbewertungen
Bisher gibt es keine Bewertungen für dieses Produkt. Haben Sie es schon ausprobiert? Dann können Sie die erste Person sein, die andere darüber informiert!

Häufig gestellte Fragen (FAQ)

Supply & Demand
Über den cTrader Store verfügbare Produkte, einschließlich Handelsbots, Indikatoren und Plugins, werden von externen Entwicklern bereitgestellt und nur zu Informations- und technischen Zugriffszwecken verfügbar gemacht. cTrader Store ist kein Broker und erbringt keine Anlageberatung, persönlichen Empfehlungen oder eine Garantie für zukünftige Performance.

Mehr von diesem Autor

Desktop-Plugin
Market Scanner
Scan supply and demand zones, track their strength and status, and receive alerts in a customizable desktop panel.
Desktop-Plugin
Market Scanner
Scan markets, compare timeframe bias, and track key SMC zones in a customizable desktop dashboard.
Desktop-Plugin
Risk/Reward
Trade Alerts
+1
Trading Chaos analysis based on Bill Williams' framework, with multi-timeframe scanning, trade zones, and alerts.
Desktop-Plugin
Market Scanner
Forecast daily ranges, compare 14 markets, and view chart projections in a compact panel to improve your trade planning.

Das könnte Sie auch noch interessieren

Indikator
Moving Average
Simple moving-average crossover markers for identifying potential trend changes directly on a cTrader chart.
Indikator
ADX
ATR
+2
GOLD SENTINEL v1.0 - A CANDLE-COLORING INDICATOR FOR GOLD.
Indikator
ATR
RSI
+5
Dual confirmation RSI + EMA crossover signals with visual alerts and dynamic ATR offsets.
Indikator
Smart Signal Reversal Trend + Patterns
Indikator
VWAP
Volume
+5
The MA Quant Volume Profile Custom Range is a trading indicator that analyzes volume distribution across the price.
Indikator
Aggressive
Supertrend
+5
Stop trading with tunnel vision! 🚫 The Heat Map Dashboard is an institutional-grade visual trading assistant
Indikator
Zero Lag MACD delivers ultra-responsive trend and divergence signals with minimal lag, empowering timely Forex entries.
Indikator
Key Levels
Support & Resistance
Add your provider's gamma levels by hand or automatically with our feed plugin, and see the gamma regime at a glance.
Indikator
AI
RSI
+18
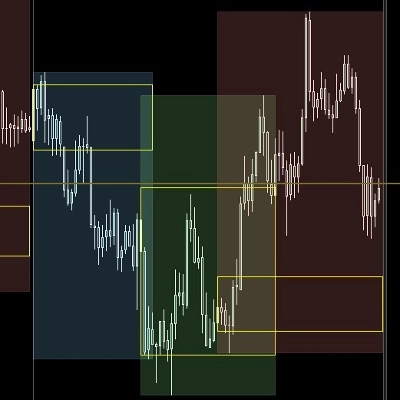
Session boxes with UTC offset, OR logic, adjustable opacity, and multi-day lookback.
Indikator
A function demo version of VWAP indicator with std. dev. bands. Expired on 1st Aug, 2025.
Indikator
Fair Value Gap
Liquidity Grab
+2
PRO Liquidity Sweep + FVG Combo detector with custom Gold/Blue signals & alerts
Indikator
ATR
RSI
+2
This indicator works best as a trend-confirmation tool—wait for multiple signals!
Indikator
Prop
Forex
+12
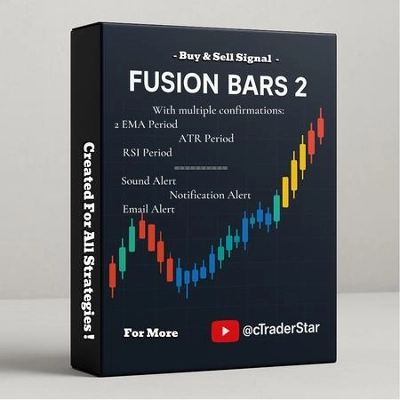
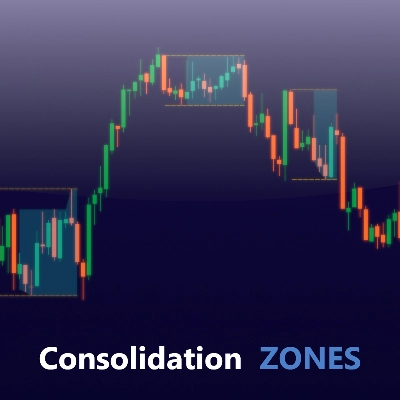
Identify and trade breakouts with Consolidation Zones! Visualize price consolidation areas for trading opportunities.
Indikator
VWAP
Volume
+5
Multi VWAP. Three timeframes. One clean chart. Your Essential Trading Tool.
Indikator
AI
SMC
+18
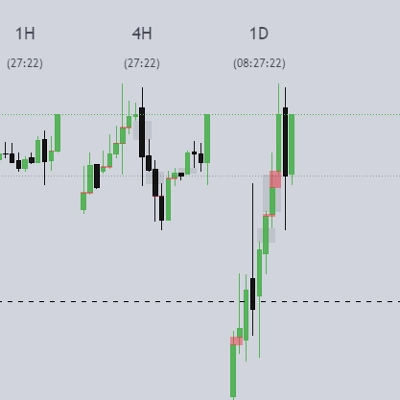
ICT HTF Candles- The Ultimate Multi-Timeframe Dashboard Stop switching timeframes and losing focus.
Indikator
Prop
Forex
+11
😎Read the description before purchasing💩
Indikator
Imbalance
Key Levels
+1
Keep open imbalance zones, untouched session highs and lows and the day's ADR range in view, without scrolling back.
Indikator
ATR
EMA
+3
Free HTF, bias, volatility and market-condition dashboard for MonsterHunt traders.

Preis

Seit 13/05/2026
27
Kostenlose Installationen