present
ลงทะเบียนและรับส่วนลด $50 สำหรับการซื้อครั้งแรกของคุณ
Trading product for Trend Direction Indicator Pro อินดิเคเตอร์ Support & Resistance, image 1
Trend Direction Indicator Pro
อินดิเคเตอร์
เวอร์ชัน 1.0, Jun 2026
Windows, Mac
Trading product for Trend Direction Indicator Pro อินดิเคเตอร์ Support & Resistance, image 2
Trading product for Trend Direction Indicator Pro อินดิเคเตอร์ Support & Resistance, image 3
Trading product for Trend Direction Indicator Pro อินดิเคเตอร์ Support & Resistance, image 4
13.9M
ปริมาณการเทรด
106.79K
Pips ที่ได้กำไร

คำอธิบาย

Custom Trend Indicator

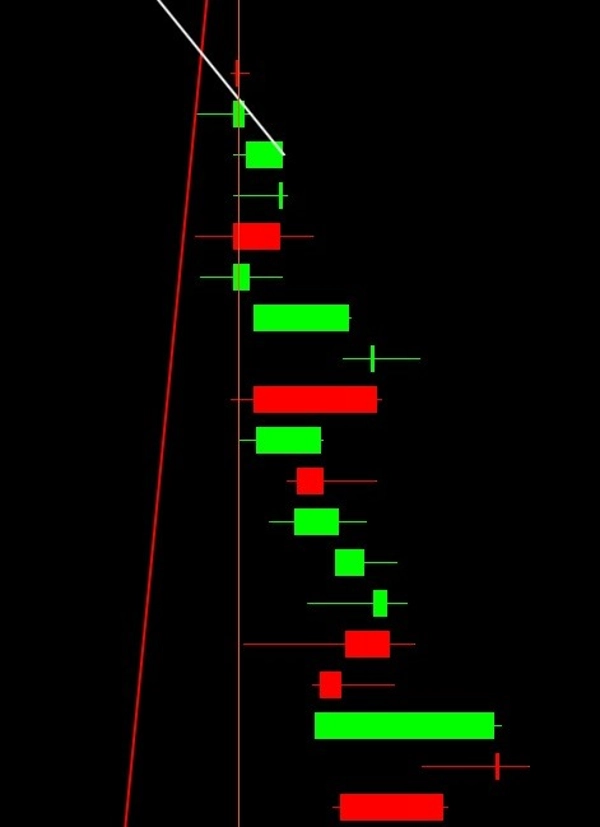
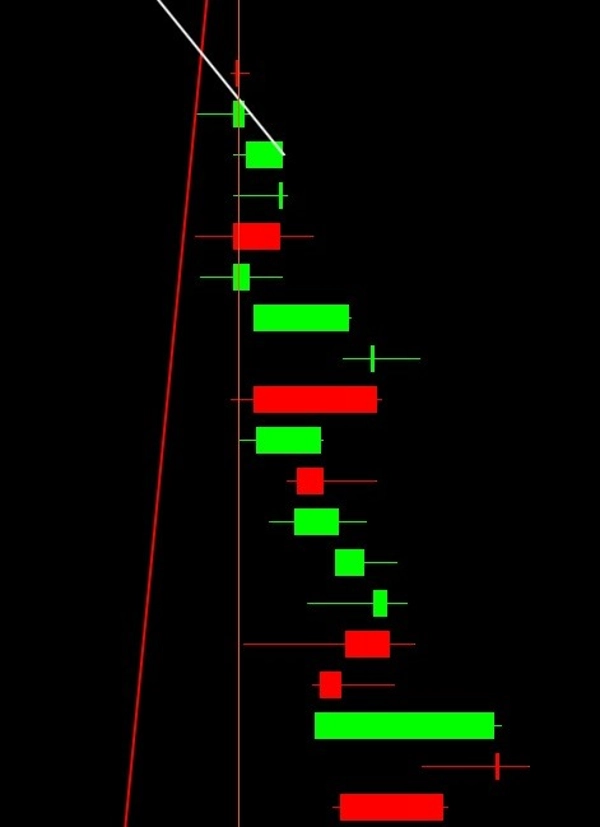
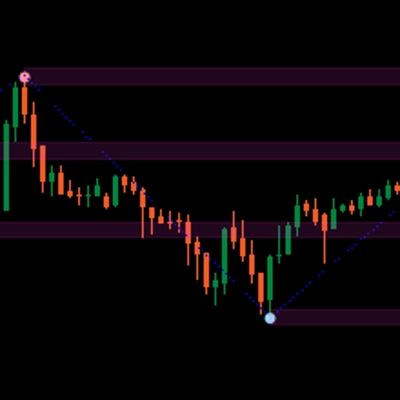
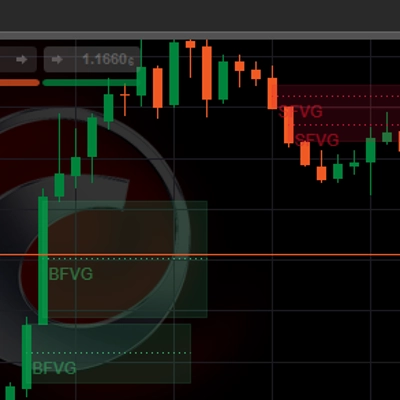
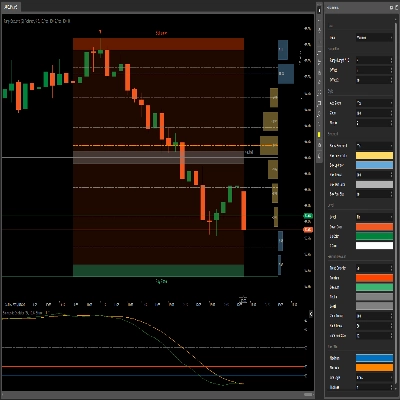
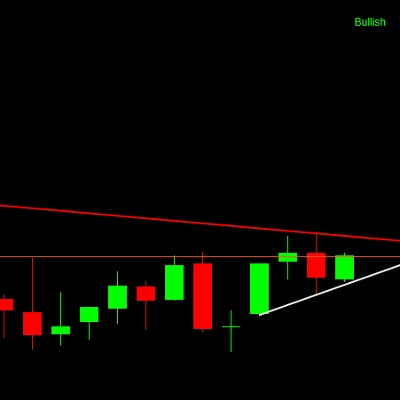
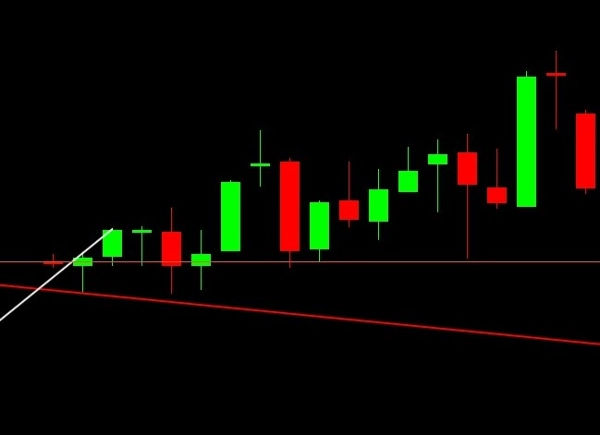
As shown on the chart, the indicator uses two trend lines to identify market direction:

  • Green Trend Line = Bullish Trend
  • Red Trend Line = Bearish Trend

How to Read the Trend

The trend direction is determined by which line is leading:

  • When the green trend line is ahead of the red trend line, the market is considered bullish, indicating upward momentum.
  • When the red trend line is ahead of the green trend line, the market is considered bearish, indicating downward momentum.

In simple terms, compare the position of the two lines:

  • Green ahead = Bullish
  • Red ahead = Bearish

This makes it easy to quickly identify the current market trend at a glance.

สรุป

โปรไฟล์อินดิเคเตอร์

การสนทนา

รีวิวจากลูกค้า

0.0
รีวิว: 0
รีวิวจากลูกค้า
ยังไม่มีรีวิวสำหรับผลิตภัณฑ์นี้ หากเคยลองแล้ว ขอเชิญมาเป็นคนแรกที่บอกคนอื่น!

คำถามที่พบบ่อย

Support & Resistance
ผลิตภัณฑ์ที่มีให้บริการผ่าน cTrader Store รวมถึงบอทการเทรด อินดิเคเตอร์ และปลั๊กอิน มีให้บริการโดยนักพัฒนาบุคคลที่สามและมีไว้เพื่อวัตถุประสงค์ในการเข้าถึงข้อมูลและทางเทคนิคเท่านั้น cTrader Store ไม่ใช่โบรกเกอร์และไม่ได้ให้คำแนะนำการลงทุน คำแนะนำส่วนบุคคล หรือการรับประกันผลการดำเนินงานในอนาคต

นอกจากนี้คุณยังอาจชอบ

อินดิเคเตอร์
Prop
Scalping
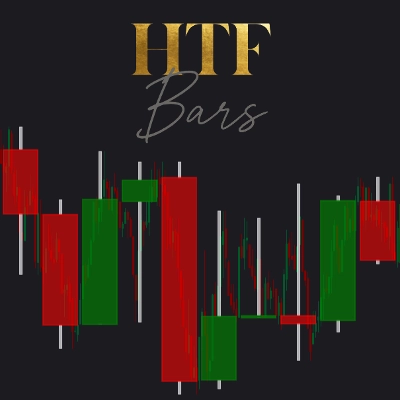
Shows bars from different Time Frame on zoom out and hides the current bars. Perfect tool for Multi TF "Market Reply"
"Trend Sniper" โลโก้
ยอดนิยม
4.3
(3)
$19
/
$29
อินดิเคเตอร์
Prop
Forex
+9
Trend Sniper — session-based tool highlighting live session ranges and adaptive Custom line.
"LT_Ind_SRZones" โลโก้
ยอดนิยม
4.5
(6)
$19
/
$25
อินดิเคเตอร์
Prop
Forex
+4
Automatic Support/Resistance zones from swing points.
อินดิเคเตอร์
BOS
Imbalance
+4
Automatically detects and highlights both Bullish and Bearish Fair Value Gaps (FVGs).
อินดิเคเตอร์
Volume
Channel
+2
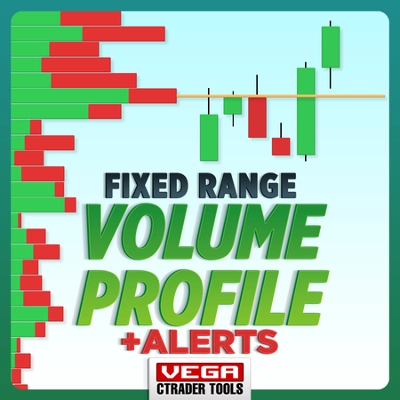
Identify key support and resistance levels through detailed volume distribution analysis.
อินดิเคเตอร์
ATR
BOS
+5
Opening ranges, dynamic trend channels, and multi-scale breakout/retest analysis for clear intraday chart decisions.
อินดิเคเตอร์
Prop
Forex
+13
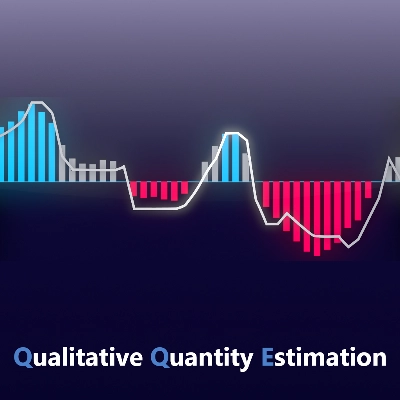
Unlock trading precision with QQE! Dual QQE indicators with a Bollinger Bands zero line provide clear buy/sell signals.
"MultiTimeFrameTrend" โลโก้
เรตติ้งสูง
4.0
(4)
$19
/
$30
อินดิเคเตอร์
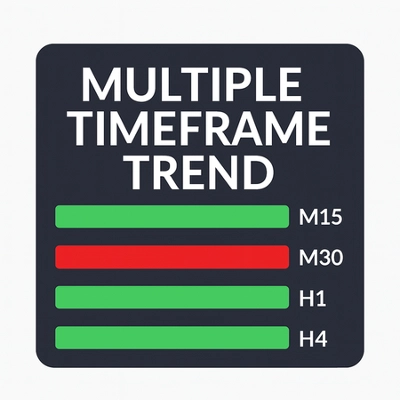
A compact, visual multi-timeframe trend indicator for cTrader. Easily spot bullish or bearish trends across 4 customizab
"Two Candle Patterns " โลโก้
เรตติ้งสูง
4.5
(7)
$19
/
$35
อินดิเคเตอร์
Forex
Crypto
+3
Detect powerful 2-candle reversal patterns at key highs/lows. Boost entries with real-time alerts and visual signals.
อินดิเคเตอร์
VWAP
Volume
+5
Multi VWAP. Three timeframes. One clean chart. Your Essential Trading Tool.
"RangeBoxLevel" โลโก้
ยอดนิยม
4.7
(4)
$29
อินดิเคเตอร์
Grid
Prop
+5
This technical analysis indicator provides information on market sentiment, trend and price levels....
อินดิเคเตอร์
Signal
USDJPY
See USD demand in one line—Composite OBV fuses six major FX pairs into a clear momentum gauge.
อินดิเคเตอร์
Supertrend
Moving Average
Easy Trade: Trend & Breakout Indicator for cTrader
อินดิเคเตอร์
Drawdown Monitor
Protect your funded account. Real-time Daily Equity Drawdown monitor with Green / Orange / Red flashing alerts.
อินดิเคเตอร์
Pin Bar
Inducement
+5
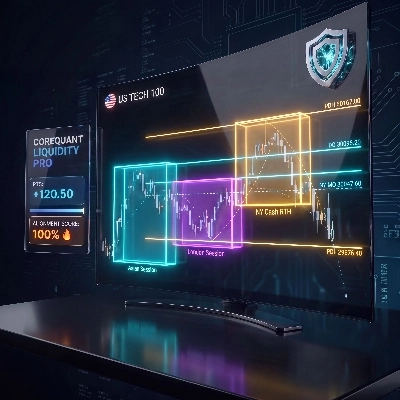
Institutional Nasdaq Session Liquidity Map with Live Point HUD, Sweep Alerts & Interactive Playbook.
อินดิเคเตอร์
AI
ATR
+27
Deep Mood Distribution (DMD) is a segmented volume-profile and sentiment tool that analyzes price action in fixed bar bl
"Buy and sell indicator" โลโก้
ยอดนิยม
4.3
(3)
$19
/
$29
อินดิเคเตอร์
AI
ATR
+20
Buy and Sell Signals
"CVD" โลโก้
ยอดนิยม
4.6
(3)
$20
/
$30
อินดิเคเตอร์
Signal
Cumulative Volume Delta tracks the net difference in tick volume between buying and selling pressure over time

ราคา

13.9M
ปริมาณการเทรด
106.79K
Pips ที่ได้กำไร