
present
ลงทะเบียนและรับส่วนลด $50 สำหรับการซื้อครั้งแรกของคุณ
Trading product for Regime Compass อินดิเคเตอร์ EMA, image 1
Regime Compass
อินดิเคเตอร์
เวอร์ชัน 1.0, Aug 2026
Windows, Mac
Trading product for Regime Compass อินดิเคเตอร์ EMA, image 2
Trading product for Regime Compass อินดิเคเตอร์ EMA, image 3
Trading product for Regime Compass อินดิเคเตอร์ EMA, image 4
ตั้งแต่ 15/08/2026

คำอธิบาย

WHAT IT DRAWS


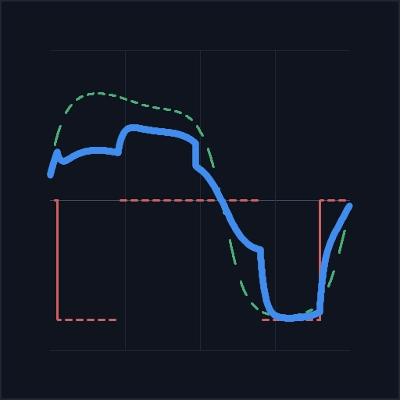
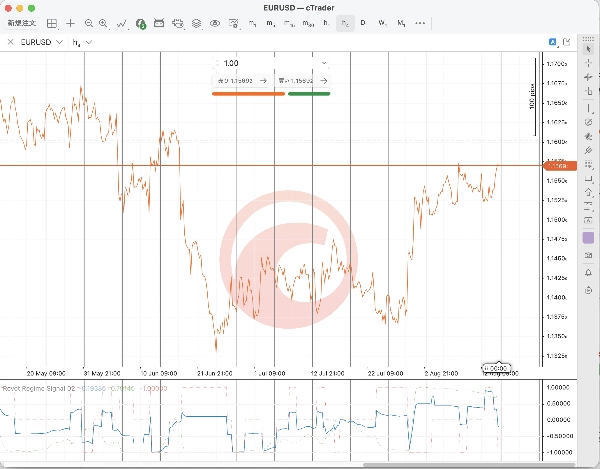
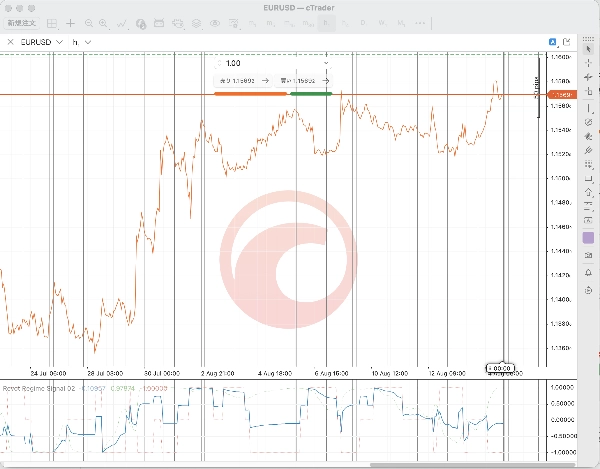
Three lines in a sub-panel below your chart.


Blended signal, blue and solid. The combined value, held between minus one and plus one.


Trend component, green and dotted. The trend half on its own.


Reversion component, red and dotted. The mean-reversion half on its own.


Seeing the two halves separately is the point. When they disagree, the blend sits near zero and you can see which side is pulling.


HOW IT IS COMPUTED


The trend half takes the ratio of a fast EMA to a slow EMA, minus one. That relative distance is standardised over its own history, bounded, and passed through tanh, so the line scales with how unusual the current separation is instead of flipping on every crossover.


The reversion half is a z-score of close over a fixed lookback. The state turns one way when the z-score reaches the entry level, the other way at the mirror level, and flattens once the z-score falls back inside the exit band. It holds its previous state in between, which is why the red line moves in steps rather than continuously.


The weighting compares short-window return volatility against long-window return volatility. When the short window runs hot relative to the long window, the blend leans towards the trend half. Otherwise it leans towards the reversion half. Follow the market when it is moving, fade it when it is quiet.


DECISION TIMING


Everything is computed on completed bars only. The forming bar is never drawn, so a value you have already seen does not change afterwards. The reversion state advances exactly once per closed bar, so a chart recalculation replays the same history rather than double-counting it.


WHAT IT DOES NOT DO


It places, modifies, cancels and closes no orders. It reads only the chart symbol's own bars. No network access, no file access, no external data feed.


It is a display. It does not forecast, and every trading decision stays yours.


PARAMETERS


The trend periods, the reversion lookback, the entry and exit levels, the two volatility windows and the weighting are fixed in this build. The line you see is one specific configuration rather than a surface you tune until it looks right.


SCOPE


This indicator was developed and checked on one instrument over one historical window. That says nothing about how it behaves on another symbol, another timeframe or another period. Run it on a demo account, on the instruments you actually trade, and decide for yourself whether the behaviour suits you.


Trading carries risk of loss.


SUPPORT


Questions answered within 3 business days. Version history published with every change.


สรุป

สรุปโดย AI
Regime Compass is a trading indicator that visualizes market conditions by blending trend and mean-reversion signals within a volatility regime. It displays three lines in a sub-panel below the price chart: a solid blue line representing the combined signal scaled between -1 and +1, a green dotted line showing the trend component alone, and a red dotted line indicating the mean-reversion component. The trend component is derived from the ratio of a fast to a slow exponential moving average (EMA), standardized and bounded to reflect the strength of the trend. The mean-reversion component is a stepwise z-score of closing prices over a fixed lookback, indicating reversion states based on entry and exit thresholds. The blend between these components is weighted by comparing short-term and long-term return volatilities, favoring trend signals during high volatility and mean-reversion signals during low volatility. All calculations are performed on completed bars only, ensuring stable and consistent values without intra-bar updates. The indicator does not execute trades or access external data; it solely reads the chart’s own bar data. Parameters such as trend periods, lookbacks, and volatility windows are fixed in this version. Regime Compass is designed for visualization and decision support, with applicability depending on the instrument and timeframe used.
โปรไฟล์อินดิเคเตอร์
หมวดหมู่อินดิเคเตอร์
Trend
ประเภทเอาต์พุต
การแสดงเป็นภาพ
ข้อกำหนดด้านข้อมูล
แท่งเท่านั้น
สัญญาณที่รองรับ
ความแข็งแกร่งของแนวโน้ม
Reversal
ความผันผวน

รีวิวจากลูกค้า

0.0
รีวิว: 0
รีวิวจากลูกค้า
ยังไม่มีรีวิวสำหรับผลิตภัณฑ์นี้ หากเคยลองแล้ว ขอเชิญมาเป็นคนแรกที่บอกคนอื่น!

การสนทนา

คำถามที่พบบ่อย

EMA
ผลิตภัณฑ์ที่มีให้บริการผ่าน cTrader Store รวมถึงบอทการเทรด อินดิเคเตอร์ และปลั๊กอิน มีให้บริการโดยนักพัฒนาบุคคลที่สามและมีไว้เพื่อวัตถุประสงค์ในการเข้าถึงข้อมูลและทางเทคนิคเท่านั้น cTrader Store ไม่ใช่โบรกเกอร์และไม่ได้ให้คำแนะนำการลงทุน คำแนะนำส่วนบุคคล หรือการรับประกันผลการดำเนินงานในอนาคต

นอกจากนี้คุณยังอาจชอบ

"SMC-ICT Control Panel" โลโก้
เรตติ้งสูง
4.2
(4)
อินดิเคเตอร์
SMC
BTCUSD
+5
SMC ICT Control Panel The all-in-one Smart Money command center for cTrader. One indicator. Every SMC/ICT tool. Zero clu
อินดิเคเตอร์
EMA
Channel
+3
Real-time squeeze detection, dual-horizon trend scoring & institutional breakout validation HUD dashboard.
อินดิเคเตอร์
ATR
EMA
+5
Multi-factor volatility squeeze detector, dual-trend scoring & breakout validation dashboard. No repaint.
อินดิเคเตอร์
Forex
Crypto
+4
Statistical boundaries that adapt to real-time volatility for a better risk management.
อินดิเคเตอร์
VWAP
Fibonacci
+5
Market Blueprint - SMC/ICT One Indicator. Eleven Core Module, Single Chart , MTF candles, MTF FVG
"cAlgoBuddy - TDI Pro" โลโก้
เรตติ้งสูง
4.7
(4)
อินดิเคเตอร์
RSI
Forex
+10
All in One indicator designed to reveal Market Sentiment.
"RangeBoxLevel" โลโก้
ยอดนิยม
4.7
(4)
อินดิเคเตอร์
Grid
Prop
+5
This technical analysis indicator provides information on market sentiment, trend and price levels....
อินดิเคเตอร์
ATR
Forex
+3
Order Block - Market Structure Signals - This is one of the main indicators in the Market Structure trading system
อินดิเคเตอร์
AI
ATR
+5
🦅 AI Institutional System: Order Blocks, Volume Delta Profile, OrderFlow Limit Buy/Sell, MTF, psychology & reversal.
อินดิเคเตอร์
SMC
Pro Volume Profile with Delta, Session Filters & CSV Export. Precision order flow analysis.
อินดิเคเตอร์
RSI
Signal
+3
The Wyckoff Toolkit is the ultimate ally for traders seeking to decode the market through the lens of "smart money."
อินดิเคเตอร์
Volume
Imbalance
+5
Professional OrderFlow Footprint Analysis ( Bid/ask, POC, VA, Delta, Absorption, Imbalance )
อินดิเคเตอร์
ATR
RSI
+5
One of the best indicators we have ever developed, with a very high profit ratio.
อินดิเคเตอร์
ATR
SMC
+20
Session boxes, liquidity sweeps and higher‑timeframe levels for intraday trading
อินดิเคเตอร์
ADX
ATR
+5
HAI QUANTUM V7.0 | The Stochastic Drift & Gravity Edition The Most Advanced Neural-Ready Trading Dashboard for cTrader
อินดิเคเตอร์
Double Top
Key Levels
+5
Indicator acts as a dynamic target identification engine based on SMC and ICT. Detects HTF Bias and Confluence liquidity
"Volume Profile Pro" โลโก้
ยอดนิยม
5.0
(3)
อินดิเคเตอร์
Prop
Forex
+5
Visualize trading volume by price within any range, highlight POC and key value areas.
อินดิเคเตอร์
Prop
Forex
+15
Footprint volume indicator showing bid/ask splits at each price level

ราคา

ตั้งแต่ 15/08/2026