
present
Registrieren Sie sich und erhalten Sie $50 Rabatt auf Ihren ersten Kauf
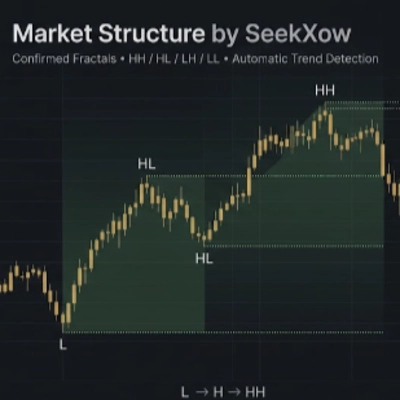
Trading product for FractalMS by SeekXow Indikator Key Levels MSS, image 1
FractalMS by SeekXow
Indikator
Version 1.0, Aug 2026
Windows, Mac
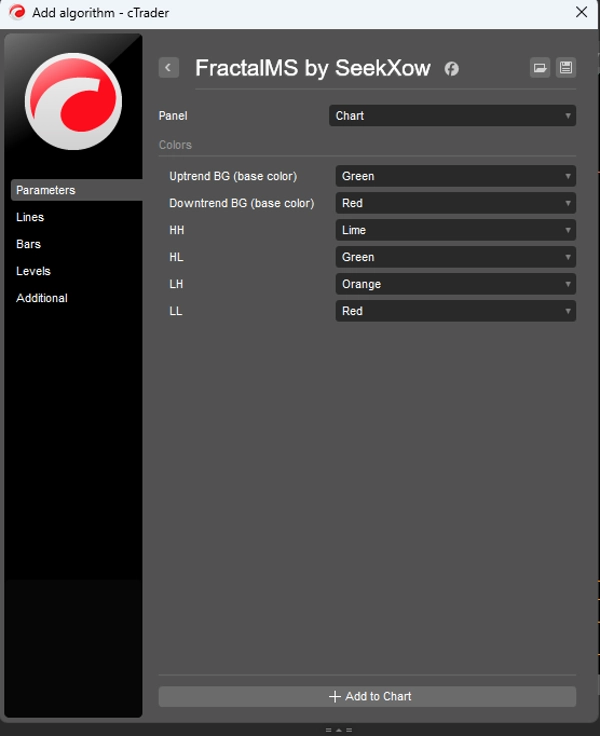
Trading product for FractalMS by SeekXow Indikator Key Levels MSS, image 2
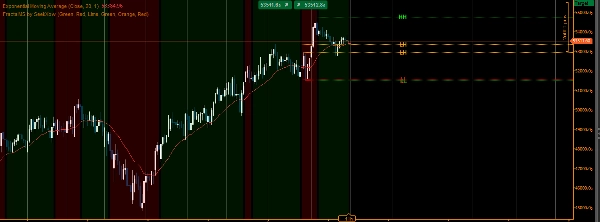
Trading product for FractalMS by SeekXow Indikator Key Levels MSS, image 3
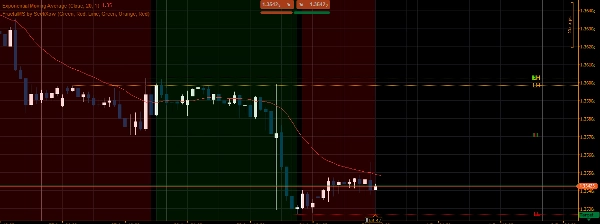
Trading product for FractalMS by SeekXow Indikator Key Levels MSS, image 4
Seit 09/12/2025
8.14M
Gehandeltes Volumen
16.34K
Pip-Gewinn

Beschreibung

Price-Action-Indikator, der entwickelt wurde, um die Marktstruktur mithilfe bestätigter Fraktal-Pivots zu identifizieren und zu visualisieren. Der Indikator verfolgt Swing-Hochs und Swing-Tiefs und klassifiziert sie in:

  • HH — Höheres Hoch
  • HL — Höheres Tief
  • LH — Niedrigeres Hoch
  • LL — Niedrigeres Tief

Er verwendet bestätigte Fraktal-Pivots, um Rauschen zu reduzieren und sich nicht auf unbestätigte Preisschwankungen zu verlassen. Aufeinanderfolgende Pivots desselben Typs werden komprimiert, sodass das relevante Extrem erhalten bleibt, bevor die Marktstruktur bewertet wird.

Hauptmerkmale

  • Bestätigte fraktalbasierte Swing-Erkennung
  • Automatische HH / HL / LH / LL Klassifizierung
  • Erkennung von bullischer und bärischer Marktstruktur
  • Automatische Trendzustandsidentifikation
  • Visuelle horizontale Strukturebenen
  • Visualisierung des Trendhintergrunds
  • Struktur passt sich an, wenn neue bestätigte Pivots entstehen
  • Entwickelt für diskretionäre Price-Action- und Marktstrukturanalyse

Funktionsweise

Der Indikator erkennt zunächst bestätigte Swing-Hochs und -Tiefs. Diese Pivots werden dann zu einer abwechselnden Sequenz von Hochs und Tiefs verarbeitet. Die resultierende Pivot-Sequenz wird verwendet, um die aktuelle Marktstruktur und den Trend zu bestimmen. Während eines Aufwärtstrends können neue Hochs Höhere Hochs etablieren, während das relevante Retracement-Tief zum Höheren Tief wird. Die entgegengesetzte Logik gilt während eines Abwärtstrends. Ein Bruch des relevanten Strukturniveaus kann eine Änderung des erkannten Trends auslösen.

Verwendungszweck

Der Indikator kann als Marktstruktur-Schicht neben Price Action, Unterstützung/Widerstand, Liquiditätsanalyse oder anderen technischen Werkzeugen verwendet werden. Er eignet sich für Trader, die eine klarere visuelle Darstellung der Swing-Struktur über verschiedene Zeitrahmen suchen.

Hinweis: Dieser Indikator ist ein Werkzeug der technischen Analyse und bietet keine Finanzberatung oder Garantie für Handelsergebnisse.

Zusammenfassung

KI-Zusammenfassung
FractalMS by SeekXow is a price-action indicator that identifies and visualizes market structure using confirmed fractal pivots. It detects swing highs and lows and classifies them into four pivot types: Higher High (HH), Higher Low (HL), Lower High (LH), and Lower Low (LL). By relying on confirmed fractal pivots, the indicator reduces noise and avoids repainting, compressing consecutive pivots of the same type to retain relevant extremes before evaluating market structure.

Key features include automatic classification of pivot types, bullish and bearish market structure detection, trend-state identification, visual horizontal structure levels, and trend background visualization. The indicator continuously adapts as new confirmed pivots develop.

FractalMS works by detecting confirmed swing highs and lows, processing them into an alternating sequence to determine current market structure and trend. During uptrends, it identifies higher highs and higher lows; during downtrends, it identifies lower highs and lower lows. Breaking structural levels signals potential trend changes.

Designed for discretionary price-action and market-structure analysis, this tool supports traders seeking a clearer visual representation of swing structure across multiple timeframes. It complements other technical tools such as support/resistance and liquidity analysis.

Indikatorprofil
Indikatorkategorie
Marktstruktur (SMC)
Ausgabetyp
Visualisierung
Datenanforderungen
Nur Balken
Unterstützte Signale
Ausbruch
Trendstärke
Level – Durchbrechen
Wendepunkt
Level – Berührung

Kundenbewertungen

0.0
Bewertungen: 0
Kundenbewertungen
Bisher gibt es keine Bewertungen für dieses Produkt. Haben Sie es schon ausprobiert? Dann können Sie die erste Person sein, die andere darüber informiert!

Diskussion

Häufig gestellte Fragen (FAQ)

Key Levels
MSS
Market Structure
Support & Resistance
Über den cTrader Store verfügbare Produkte, einschließlich Handelsbots, Indikatoren und Plugins, werden von externen Entwicklern bereitgestellt und nur zu Informations- und technischen Zugriffszwecken verfügbar gemacht. cTrader Store ist kein Broker und erbringt keine Anlageberatung, persönlichen Empfehlungen oder eine Garantie für zukünftige Performance.

Mehr von diesem Autor

cBot
Key Levels
Conservative
+5
XAUUSD market-structure cBot with dynamic risk, adaptive entries and automated trade management.
3.8
Gewinnfaktor

Das könnte Sie auch noch interessieren

Indikator
Prop
Forex
+4
Personal trade tracker for a single symbol. Clear net profit summary — FreshNet, ManageNet, DayNet, WTDNet, MTDNet.
Indikator
ATR
RSI
+7
Track the Movement of Market Assets with an Oscillator Scanner in Real-Time!
Indikator
Moving Average
An Indicator made for scalping. Shows you the Sniper movement on Chart with the colour signals.
Indikator
ATR
Forex
+5
🚀 Buy and sell signals 📈📉 only when three independent engines agree simultaneously.
Indikator
Prop
Forex
+11
😎Read the description before purchasing💩
Indikator
Inside Bar
Save time by lighting a candle to look within yourself in another temporality
Indikator
The Weekly Daily Levels indicator shows the OHLC, and mid-point prices for the previous day and week.
Indikator
Prop
Forex
+13
🎯Automatically detects and visualizes classical chart patterns using multi-timeframe swing point analysis.
Indikator
Prop
Forex
+5
Pivot Point with base zone daily Asia-London-New york Session.
Indikator
SMC
Prop
+17
Unlock the true intent of market participants with the Classic Proportional Cumulative Volume Delta CVD!
Indikator
Forex
BTCUSD
+4
The Linear Regression Oscillator (LRO) is a technical indicator based on linear regression analysis.
„Dem“-Logo
Beste Ratings
4.2
(4)
$20
Indikator
Forex
BTCUSD
+5
Scalping indicator for Renko 100 using EMAs to show trend and entry zones with clear colored rectangles.
Indikator
BOS
Order Block
+3
Not every order block deserves your attention.
Indikator
Key Levels
Order Block
+5
Pixel-perfect trading zones in a click! Instantly draw, resize & color via hotkeys. Automate your charting routine
Indikator
Master RSI reversals with Parabolic SAR precision! Get real-time alerts for high-probability trend changes.
Indikator
RSI
Forex
+4
😎Read the description before purchasing💩
Indikator
ATR
RSI
+9
🚀 MACARX Indicator - The Multi-Indicator Trend Fusion 🚀
Indikator
ADX
ATR
+1
Indicador de Sinais Visuais para Spotcrude (WTI) ou SpotBrent com filtros de tendência, operacional de 10 e 15 minutos.

Preis

Seit 09/12/2025
8.14M
Gehandeltes Volumen
16.34K
Pip-Gewinn
















