
Description
Niveaux de Nombres Ronds - Indicateur pour cTrader
Description
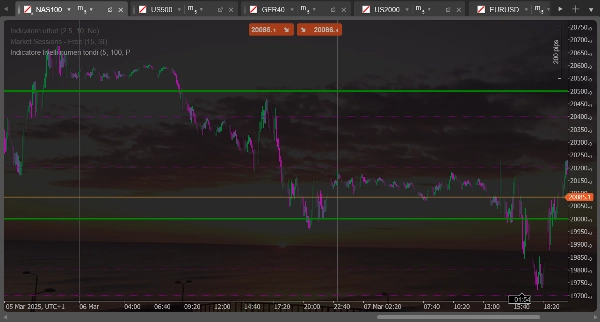
Cet indicateur trace des lignes horizontales à des "nombres ronds" ou à des niveaux psychologiquement significatifs sur le graphique. Il est idéal pour identifier des zones potentielles de support et de résistance basées sur des niveaux de prix ronds qui ont souvent une importance psychologique pour les traders.
Fonctions principales
- Trace deux ensembles distincts de lignes horizontales à intervalles réguliers
- Calcule automatiquement les niveaux en fonction du prix de clôture actuel
- Se met à jour dynamiquement lorsque le prix évolue
- Offre une configuration séparée pour chaque ensemble de lignes (couleur, style, taille)
Réglages possibles
Pour le premier ensemble de lignes (pointillées)
- Nombre de Lignes Ensemble 1 : Détermine combien de lignes tracer au-dessus et en dessous du prix actuel (par défaut : 5)
- Taille de l'Intervalle Ensemble 1 : Définit la distance entre les lignes en pips (par défaut : 100 pips)
- Couleur des Lignes Ensemble 1 : Personnalise la couleur des lignes (par défaut : violet)
- Épaisseur des Lignes Ensemble 1 : Définit l'épaisseur des lignes (par défaut : 1 pixel)
Pour le deuxième ensemble de lignes (pleines)
- Nombre de Lignes Ensemble 2 : Détermine combien de lignes tracer au-dessus et en dessous du prix actuel (par défaut : 2)
- Taille de l'Intervalle Ensemble 2 : Définit la distance entre les lignes en pips (par défaut : 500 pips)
- Couleur des Lignes Ensemble 2 : Personnalise la couleur des lignes (par défaut : vert)
- Épaisseur des Lignes Ensemble 2 : Définit l'épaisseur des lignes (par défaut : 1 pixel)
Utilisation pratique
Typiquement, le premier ensemble (lignes pointillées) est utilisé pour identifier des niveaux psychologiques mineurs, tandis que le deuxième ensemble (lignes pleines) met en évidence des niveaux psychologiques majeurs. Par exemple, pour EURUSD, vous pourriez configurer le premier ensemble pour afficher des niveaux tous les 100 pips (comme 1.0800, 1.0900) et le deuxième ensemble pour des niveaux tous les 500 pips (comme 1.0500, 1.1000).
Ces niveaux coïncident souvent avec des zones de support ou de résistance où le prix pourrait rebondir ou ralentir avant de poursuivre son mouvement.
Round Number Levels - Indicator for cTrader
Description
This indicator draws horizontal lines at "round numbers" or psychologically significant levels on the chart. It's ideal for identifying potential support and resistance areas based on round price levels that often have psychological importance for traders.
Main Features
- Draws two distinct sets of horizontal lines at regular intervals
- Automatically calculates levels based on the current closing price
- Updates dynamically as price moves
- Offers separate configuration for each set of lines (color, style, size)
Possible Adjustments
For the first set of lines (dashed)
- Number of Lines Set 1: Determines how many lines to draw above and below the current price (default: 5)
- Range Size Set 1: Sets the distance between lines in pips (default: 100 pips)
- Line Color Set 1: Customizes the color of the lines (default: purple)
- Line Width Set 1: Sets the thickness of the lines (default: 1 pixel)
For the second set of lines (solid)
- Number of Lines Set 2: Determines how many lines to draw above and below the current price (default: 2)
- Range Size Set 2: Sets the distance between lines in pips (default: 500 pips)
- Line Color Set 2: Customizes the color of the lines (default: green)
- Line Width Set 2: Sets the thickness of the lines (default: 1 pixel)
Practical Usage
Typically, the first set (dashed lines) is used to identify minor psychological levels, while the second set (solid lines) highlights major psychological levels. For example, for EURUSD, you might set the first set to show levels every 100 pips (such as 1.0800, 1.0900) and the second set for levels every 500 pips (such as 1.0500, 1.1000).
These levels often coincide with support or resistance zones where price might bounce or slow down before continuing its movement.
Résumé
Avis clients
5 | 50 % | |
4 | 50 % | |
3 | 0 % | |
2 | 0 % | |
1 | 0 % |


