الوصف
تقديم مخطط MACD المحسن، المصمم لتوفير تجربة تداول أوضح وأكثر فهماً.
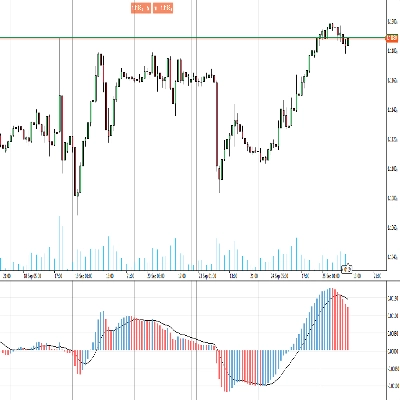
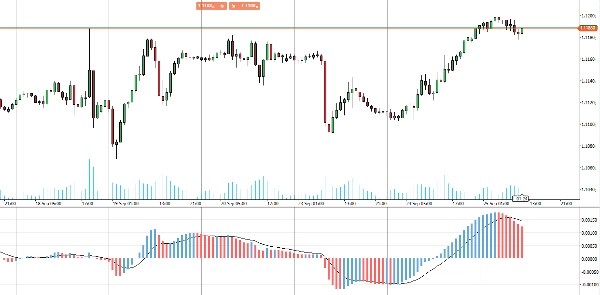
يعرض هذا المؤشر المطور مخططًا ملونًا نابضًا يميز بين تغيرات الأسعار الصاعدة والهابطة، متجاوزًا التنسيق أحادي اللون الافتراضي. باستخدام ألوان مميزة للحركات الإيجابية والسلبية، فإنه يقدم إشارة بصرية فورية لحالة السوق، مما يسهل تفسير تحولات الزخم والانعكاسات المحتملة للاتجاه.
مثالي للمتداولين الذين يسعون إلى وضوح ودقة محسنة، يحول هذا مخطط MACD المطور الرسم البياني الخاص بك إلى أداة تحليلية أكثر قوة. ارتقِ باستراتيجيتك التداولية مع مخطط MACD المحسن.
الملخص
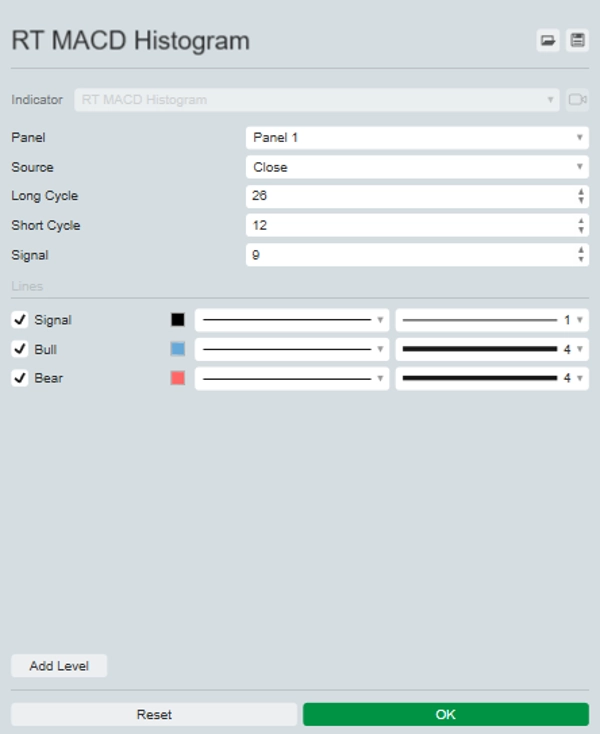
ملف تعريف المؤشر
تقييمات العملاء
0.0
التقييمات: 0
تقييمات العملاء
لا توجد تقييمات لهذا المنتج حتى الآن. هل جرَّبته بالفعل؟ كن أول من يخبر الآخرين!
مناقشة
الأسئلة الشائعة
BTCUSD
Forex
Signal
Indices
EURUSD
Commodities
GBPUSD
NZDUSD
Prop
Scalping
Crypto
Stocks
XAUUSD
NAS100
MACD
USDJPY
يتم توفير المنتجات المتاحة من خلال cTrader Store، بما في ذلك روبوتات التداول والمؤشرات والإضافات، من قبل مطوري الطرف الثالث وإتاحتها لأغراض الوصول المعلوماتي والفني فقط. cTrader Store ليس وسيطًا ولا يقدم نصائح استثمارية أو توصيات شخصية أو أي ضمان للأداء المستقبلي.


![شعار "[Hamster-Coder] Pivot Points MTF"](https://cdn.ctrader.com/image/webp/4c143e5a-309c-40e3-a578-f04d1e133ffa_31159)


السعر
منذ 25/09/2024
20
المبيعات