present
سجل واحصل على خصم 50 دولارًا على مشترياتك الأولى
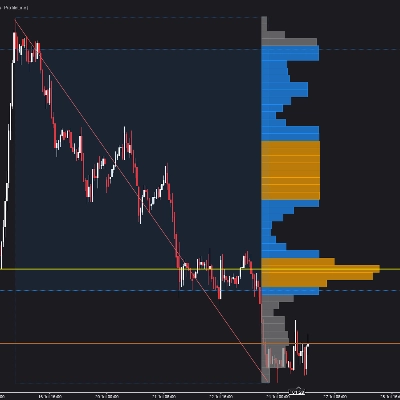
Trading product for Time To Break Even Indicator v2 مؤشر, image 1
Time To Break Even Indicator v2
مؤشر
الإصدار 1.0، May 2025
Windows, Mac
4.6
التقييمات: 3
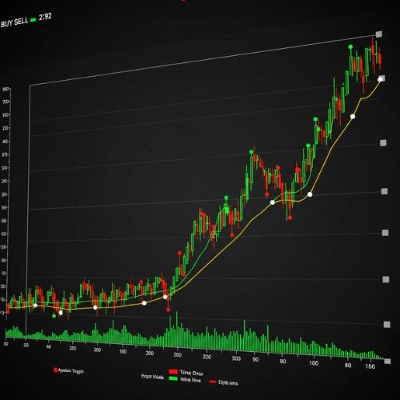
Trading product for Time To Break Even Indicator v2 مؤشر, image 2
Trading product for Time To Break Even Indicator v2 مؤشر, image 3
Trading product for Time To Break Even Indicator v2 مؤشر, image 4
منذ 26/05/2025
280
التثبيتات المجانية

الوصف

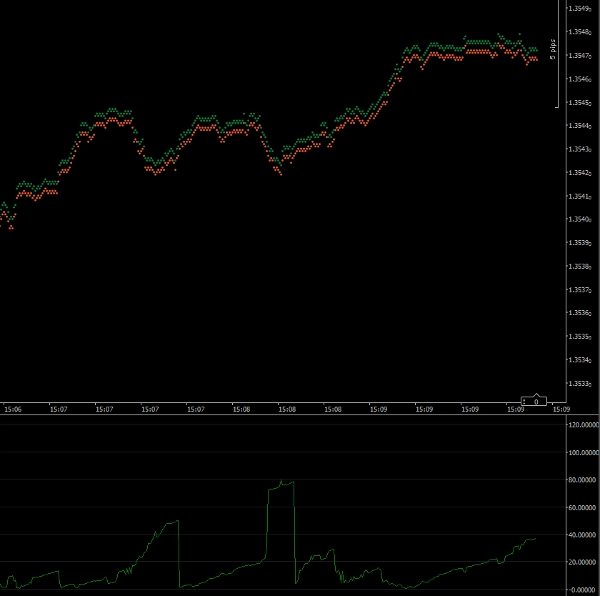
مؤشر وقت التعادل الإصدار 2

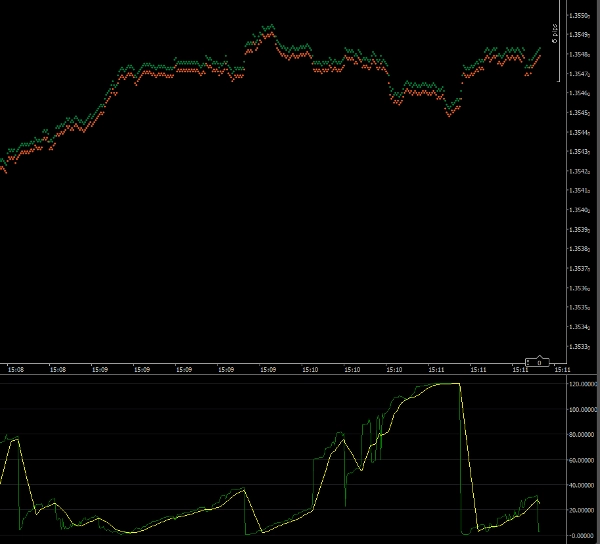
سيساعدك هذا المؤشر في توقيت دخول تداولك إلى السوق. يعرض الرسم البياني العدد المحتمل من الثواني التي يحتاجها تداولك ليصل إلى نقطة التعادل. إذا كان السوق يتحرك بسرعة وفي اتجاهك، فسيعطي المؤشر رقمًا صغيرًا. إذا كان السوق يتحرك ضدك أو ببطء، فسيكون الرقم أكبر.

يحسب المؤشر عدد النقاط التي يحتاجها تداولك ليصل إلى نقطة التعادل. ثم يقارن هذا بالسرعة الحالية التي يتحرك بها السعر.


ملاحظة: يجب تشغيل هذا المؤشر على إطار زمني 1 تيك.


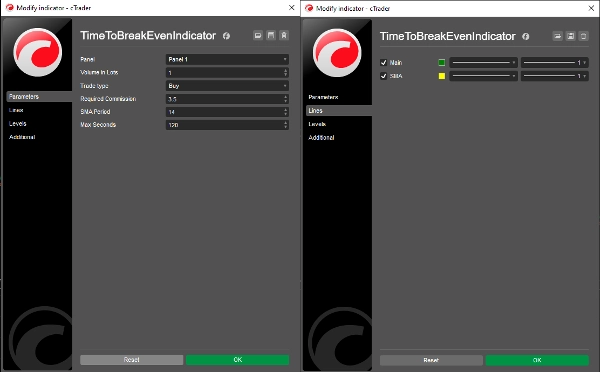
المعلمات

الحجم باللوتات: حجم تداولك المقترح

نوع التداول: سواء كان تداولك شراء أو بيع

العمولة المطلوبة: العمولة التي سيتكبدها تداولك (يمكنك الحصول عليها من نافذة التداول السريع)

فترة المتوسط المتحرك البسيط: فترة رسم المتوسط المتحرك البسيط (الافتراضي = 14)

الحد الأقصى للثواني: الحد الأقصى لعدد الثواني التي سيتم تسجيلها (انظر أدناه)

الخطوط

الرئيسي: خط رسم المؤشر (الافتراضي = أخضر)

المتوسط المتحرك البسيط: خط رسم المتوسط المتحرك البسيط (الافتراضي = أصفر)


الحد الأقصى للثواني

السماح للمؤشر بعرض قيم كبيرة جدًا يعني أن مقياس المؤشر سيمنعك من رؤية التفاصيل عندما يكون وقت التعادل صغيرًا. يتيح لك تعيين هذه المعلمة ضبط الحد الأقصى لمقياس المؤشر. بشكل افتراضي يتم تعيينه على 120 (دقيقتان). لذلك أي ناتج 2 دقيقة أو أكثر سيتم رسمه كـ 120 ثانية.


الدكتور آندي لاركين

حقوق النشر 2025، جميع الحقوق محفوظة

26 مايو 2025


القانوني

يجب التحقق من دقة النتائج من هذا المؤشر قبل استخدامه في التداول المباشر.

لا يتم تقديم أي ضمان أو ضمني لنتائج هذا المؤشر.

لا يتم قبول أي مسؤولية عن أي خسائر ناتجة عن استخدام هذا المؤشر.

الملخص

AI summary
The Time To Break Even Indicator v2 is a trading indicator designed to assist traders in timing their market entries. It calculates the number of pips required for a trade to break even and compares this with the current price movement speed. The indicator then plots the estimated time in seconds for the trade to reach break-even. A smaller value indicates a fast-moving market in the trade’s favor, while a larger value suggests slower or adverse price movement.

This indicator is intended for use on the 1 Tick Time Frame. Key configurable parameters include trade volume (in lots), trade type (buy or sell), required commission, the period for the Simple Moving Average (SMA) plot (default 14), and a maximum seconds limit to control the indicator’s scale (default 120 seconds). The indicator displays two lines: the main plot line (default green) and the SMA plot line (default yellow).

By limiting the maximum seconds displayed, the indicator maintains detail visibility when break-even times are short. Users should verify the indicator’s results for accuracy before live trading. No warranty or liability is provided for trading outcomes based on this indicator.
ملف تعريف المؤشر

تقييمات العملاء

4.6
التقييمات: 3
5
67 %
4
33 %
3
0 %
2
0 %
1
0 %
تقييمات العملاء
June 9, 2025
Messy ideas are easier to pass on, but it can add noise if overused.
May 31, 2025
The setup improves when it adds a useful layer without forcing action. A clean signal can still fail.
May 29, 2025
The trading notes stop feeling so random, but demo first makes more sense.

مناقشة

الأسئلة الشائعة

يتم توفير المنتجات المتاحة من خلال cTrader Store، بما في ذلك روبوتات التداول والمؤشرات والإضافات، من قبل مطوري الطرف الثالث وإتاحتها لأغراض الوصول المعلوماتي والفني فقط. cTrader Store ليس وسيطًا ولا يقدم نصائح استثمارية أو توصيات شخصية أو أي ضمان للأداء المستقبلي.

المزيد من هذا المؤلف

مؤشر
This Indicator will display either the speed or the acceleration of the current symbol.
مؤشر
This is the trial version of Time To Break Even, which help you time your trade entry.

قد يعجبك أيضًا

مؤشر
Volume
Imbalance
+5
Spot Institutional Order Flow with Proportional Volume Bubbles & Integrated Cumulative Volume Delta (CVD) Intelligence.
مؤشر
Prop
VWAP
+5
Multi-anchor VWAP indicator for cTrader. Plots two VWAP lines (red and blue) with selectable anchors.
مؤشر
Doji
Volume
+5
Instantly spot high-liquidity institutional moves with clean, non-obtrusive triangle alerts on cTrader charts.
مؤشر
Drawdown Monitor
Protect your funded account. Real-time Daily Equity Drawdown monitor with Green / Orange / Red flashing alerts.
مؤشر
ATR
RSI
+5
Advanced Anchored VWAP for cTrader: volatility bands, real‑time alerts & customizable session resets.
مؤشر
Supertrend
Moving Average
Easy Trade: Trend & Breakout Indicator for cTrader
شعار "OrderPrice-V3"
الأعلى تقييمًا
4.0
(4)
$19
مؤشر
RSI
MACD
+2
A straightforward yet effective tool signals entry points for both buying and selling. Include 3 Moving Average
مؤشر
SMC
Prop
+9
PDL/PDH/PWL/PWH and Session higs/lows (customizable)
مؤشر
Volume
Imbalance
+1
Volume profile indicator that auto-detects the latest trendline. Shows POC, Value Area (VAH/VAL), and High Volume Nodes
شعار "Major Tops and Bottoms"
الأعلى تقييمًا
4.2
(4)
$29
مؤشر
Signal
Scalping
Average accuracy of around 60% to 70% on 45min timeframes it is highly recommended to use stop losses
مؤشر
AI-assisted
Order Block
+5
The daily bias estimator indicator uses ICT concepts to show whether the chart is bullish or bearish on multi-time frame
مؤشر
Prop
Forex
+5
Transform your approach to trading with our innovative Pivot Point Indicator.
مؤشر
Volume
Key Levels
View tick activity across a selected chart range with Point of Control, Value Area High and Value Area Low.
مؤشر
Indices
Commodities
The Advanced CCI & EMA Indicator combines the CCI with 40 & 80 EMA logic to generate precise arrows signaling direction
شعار "ADXMultiframeIndicator"
الأعلى تقييمًا
4.7
(4)
$19
/
$29
مؤشر
Indices
Multi-Timeframe ADX Trend Dots & Arrows
مؤشر
Signal
Trades Opening Range Breakouts Indicator with dynamic stops/targets adapting to market volatility.
مؤشر
AI
ATR
+20
Detects smart money activity using advanced tick volume and price divergence analysis.
مؤشر
Prop
Forex
+4
Automatic Support/Resistance zones from swing points.

السعر

منذ 26/05/2025
280
التثبيتات المجانية