
Описание
Ultimate RSI (Индекс относительной силы)
The Ultimate RSI — это усовершенствованный и настроенный осциллятор, предназначенный для более плавного, чистого и отзывчивого отображения рыночного импульса и силы тренда. Он представляет собой значительное улучшение по сравнению с традиционным индексом относительной силы (RSI), сосредотачиваясь на фильтрации рыночного шума и минимизации ложных сигналов (фальшивых пробоев). Это делает его незаменимым инструментом для подтверждения трендов и точного определения надежных точек разворота.
Основные особенности и улучшения:
- Улучшенный расчет импульса: Индикатор использует сложный метод расчета изменения цены. Вместо того чтобы полагаться исключительно на ежедневные ценовые движения, сигнал импульса значительно усиливается, когда цена фиксирует новый максимум или минимум в пределах периода просмотра. Этот процесс обеспечивает мощную реакцию индикатора на реальные пробои, игнорируя при этом незначительные колебания.
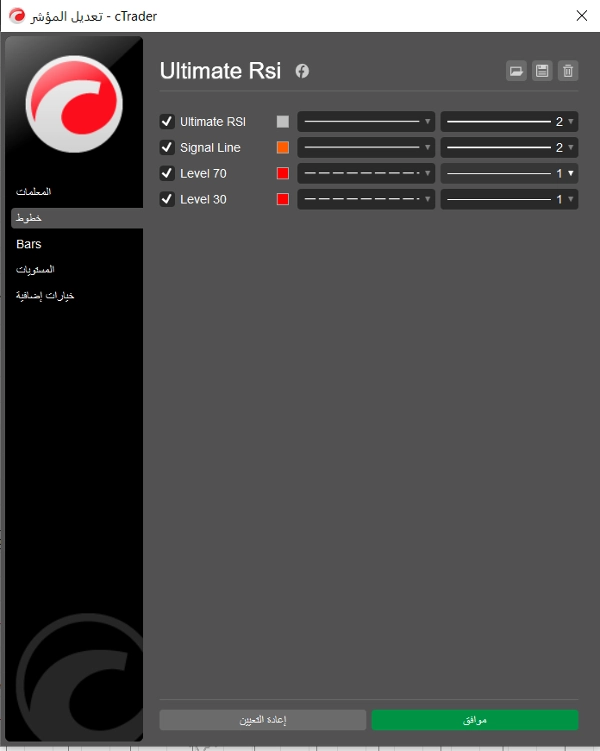
- Отдельная сигнальная линия: Включает отдельную Сигнальную линию (скользящую среднюю самого RSI), которую можно настраивать независимо. Пересечения между линией Ultimate RSI и ее Сигнальной линией часто используются как более четкие и надежные сигналы для входа или выхода, особенно вблизи уровней перекупленности/перепроданности.
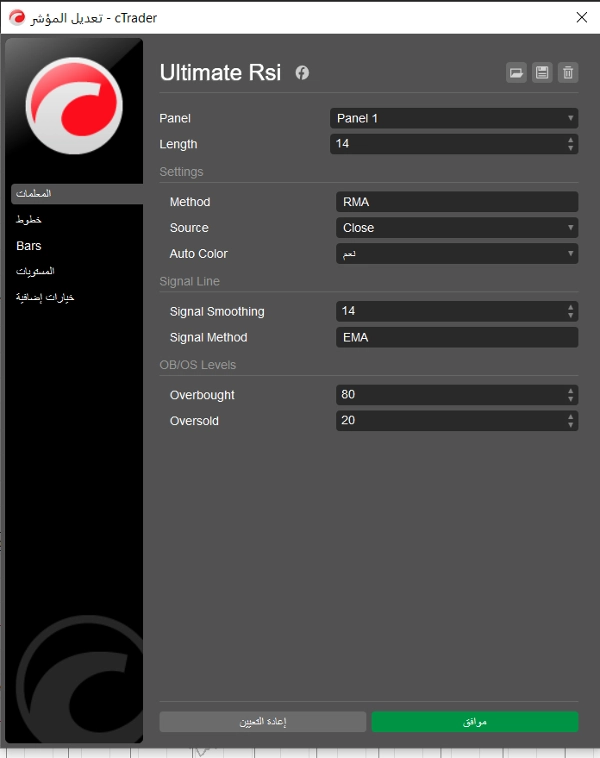
- Гибкие методы сглаживания: Пользователи могут выбирать тип сглаживания как для расчета RSI, так и для Сигнальной линии из распространенных вариантов: EMA (экспоненциальная скользящая средняя), SMA (простая скользящая средняя), RMA (скользящая средняя Уайлдера) и TMA (треугольная скользящая средняя). Это позволяет точно настраивать чувствительность индикатора.
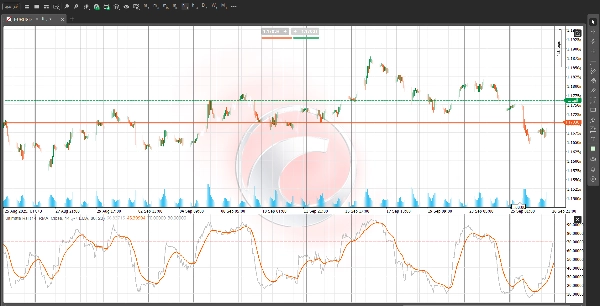
- Визуальные зоны перекупленности/перепроданности: Уровень перекупленности (OB) по умолчанию установлен на 80, а уровень перепроданности (OS) — на 20, которые четко выделены фоновым затенением. На рынках с сильным трендом устойчивые показания в этих зонах часто указывают на исключительную силу тренда, а не на немедленный разворот, предоставляя мощный инструмент подтверждения для стратегий следования за трендом.
Как торговать с Ultimate RSI:
- Подтверждение тренда: Используйте уровень 50 как центр импульса. Показания стабильно выше 50 подтверждают бычий настрой, а ниже 50 — медвежий.
- Сигналы для входа: Следите за пересечением линии Ultimate RSI сверху с Сигнальной линией для возможного входа в длинную позицию и пересечением снизу для возможного входа в короткую позицию, обращая особое внимание на то, где эти пересечения происходят относительно уровня 50.
- Снижение шума: За счет акцентирования на расширении истинного диапазона и использования продвинутого сглаживания Ultimate RSI помогает трейдерам сохранять концентрацию в периоды консолидации, предотвращая преждевременные входы или выходы.
Отказ от ответственности: Это описание предназначено только для информационных и образовательных целей. Торговля связана с риском, и все показания индикатора должны использоваться в сочетании с комплексным анализом ценового действия при принятии торговых решений.


