Descripción
PatternScanner – Detector automático de patrones de gráfico para cTrader
PatternScanner es un detector visual de patrones de gráfico para cTrader que encuentra automáticamente las estructuras clásicas de reversión más importantes y las dibuja directamente en tu gráfico.
En lugar de buscar manualmente patrones barra por barra, el indicador escanea los máximos y mínimos de oscilación en tiempo real y resalta:
- Cabeza y Hombros (H&S) – bajista
- Cabeza y Hombros Invertido (INV H&S) – alcista
- Doble Techo (DT) – bajista
- Doble Suelo (DB) – alcista
- Orejas de Lobo (WOLF) – un patrón de estilo “doble techo” con un segundo pico ligeramente más alto
Cada patrón está marcado con una etiqueta (H&S, INV H&S, DT, DB, WOLF) y un conjunto de líneas que delinean la estructura, para que puedas ver el patrón de un vistazo sin conjeturas.
Características clave
- ✅ Detecta automáticamente máximos y mínimos de oscilación y construye patrones a partir de ellos
- ✅ Identifica Cabeza y Hombros y Cabeza y Hombros Invertido con una línea de cuello dibujada
- ✅ Detecta Dobles Techos / Dobles Suelos y conecta los dos máximos/mínimos clave
- ✅ Reconoce Orejas de Lobo sin superponerse con la señal estándar de Doble Techo
- ✅ Dibuja líneas zig-zag entre puntos de oscilación para delinear visualmente cada patrón
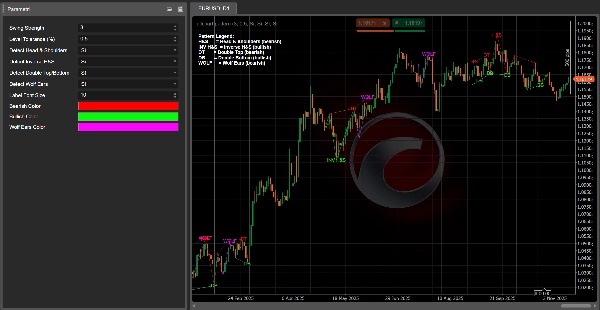
- ✅ Leyenda integrada en la esquina superior izquierda que explica todos los códigos de patrones (H&S, INV H&S, DT, DB, WOLF)
- ✅ Superposición total – todo se dibuja en el gráfico de precios, no se necesita ventana adicional
Entradas / Parámetros
- Fuerza de oscilación – Número de barras usadas para confirmar un máximo/mínimo de oscilación (sensibilidad del pivote).
- Tolerancia de nivel (%) – Qué tan similares deben ser dos máximos/mínimos para considerarse “en el mismo nivel”.
- Detectar Cabeza y Hombros – Activar/desactivar la detección de H&S.
- Detectar H&S Invertido – Activar/desactivar la detección de H&S invertido.
- Detectar Doble Techo/Suelo – Activar/desactivar la detección de DT/DB.
- Detectar Orejas de Lobo – Activar/desactivar la detección de Orejas de Lobo.
- Tamaño de fuente de etiqueta – Tamaño de las etiquetas de patrón en el gráfico.
- Color bajista – Color usado para patrones bajistas (H&S, DT, WOLF).
- Color alcista – Color usado para patrones alcistas (INV H&S, DB).
- Color Orejas de Lobo – Color dedicado para las líneas y etiqueta del patrón WOLF.
Cómo dibuja los patrones
- Cabeza y Hombros / H&S Invertido
-
- Línea zig-zag a través de los 5 puntos clave de oscilación (hombro – cabeza – hombro).
- Línea de cuello dibujada como una línea de tendencia punteada entre los dos mínimos (para H&S) o dos máximos (para H&S invertido).
- Doble Techo / Doble Suelo
-
- Una etiqueta (DT o DB) en el segundo techo/suelo.
- Una línea de tendencia que conecta los dos máximos (DT) o dos mínimos (DB).
- Orejas de Lobo
-
- Zig-zag a través de la estructura Alto–Bajo–Alto.
- Línea de resistencia punteada a través de los dos picos.
- Orejas de Lobo solo se señala cuando el segundo alto es claramente más alto que el primero, por lo que no se superpone con un Doble Techo normal.
Cómo usarlo
Adjunta PatternScanner a cualquier símbolo y marco temporal y déjalo actuar como un radar visual para las principales estructuras de reversión:
- Detecta posibles zonas de reversión alrededor de patrones H&S, DT/DB y WOLF
- Combínalo con tus propios filtros (tendencia, volumen, soporte/resistencia) para entradas de trading
- Usa la leyenda en la esquina superior izquierda para leer rápidamente qué patrón se muestra
No es un sistema de trading independiente, sino una poderosa herramienta de reconocimiento de patrones que te ahorra tiempo y te ayuda a concentrarte en las estructuras más interesantes del gráfico.
👉 Únete a nuestra comunidad
Dentro del servidor encontrarás:
- Soporte para este y mis otros indicadores/cBots de cTrader
- Discusión de estrategias, ejemplos de patrones e ideas de optimización
- Actualizaciones, noticias y futuras herramientas que lance
Resumen
Valoraciones de clientes
5 | 0 % | |
4 | 100 % | |
3 | 0 % | |
2 | 0 % | |
1 | 0 % |