Descripción
📌 Qué hace el indicador
MarketStructureOscSignals es una herramienta de señal basada únicamente en la acción del precio.
Hace lo siguiente:
- Detecta máximos y mínimos oscilantes usando una mirada hacia la izquierda/derecha.
- Sigue si esos oscilantes están formando:
-
- Máximos más altos + mínimos más altos → estructura alcista
- Máximos más bajos + mínimos más bajos → estructura bajista
- Cuando la estructura cambia:
-
- De bajista → alcista → dibuja una señal de COMPRA
- De alcista → bajista → dibuja una señal de VENTA
Así que cada señal representa un verdadero cambio en la estructura del mercado, no solo un cruce de medias móviles.
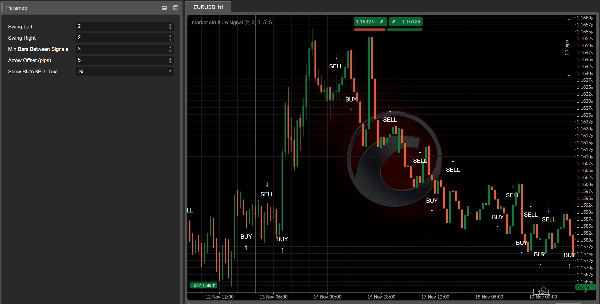
⚙️ Entradas y cómo configurarlas
1. Swing Left / Swing Right
Controlan cuán “estricto” es un máximo/mínimo oscilante.
- Swing Left (por defecto 2)
Número de barras a la izquierda del oscilante que deben tener máximos más bajos (para un máximo oscilante) o mínimos más altos (para un mínimo oscilante). - Swing Right (por defecto 2)
Número de barras a la derecha que también deben confirmar el oscilante.
Cómo usarlo:
- Valores pequeños (1–2):
-
- Más oscilantes, más señales
- Funciona bien en marcos temporales mayores (H1, H4, D1)
- Valores grandes (3–4+):
-
- Solo giros estructurales importantes
- Menos señales pero más fuertes
- Bueno en marcos temporales menores para evitar ruido
2. Min Bars Between Signals
Número mínimo de barras que deben pasar entre dos señales.
- Evita aglomeraciones de flechas en cada pequeño retroceso.
- Ejemplo:
-
- Configurado en
3→ al menos 3 barras entre una señal y la siguiente. - En gráficos muy rápidos (M1–M5) puede querer
5–10. - En H1 o superior,
2–3suele ser suficiente.
- Configurado en
3. Arrow Offset (pips)
Qué tan lejos se colocan la flecha y la etiqueta de la vela (en pips).
- Para Forex:
-
5–10pips generalmente se ve bien.
- Para índices (US500, US100, etc.):
-
- Use un desplazamiento mayor (p. ej. 20–50 “pips” dependiendo del tamaño del pip del broker).
Si las flechas se superponen con las velas, aumente este valor.
Si están demasiado lejos, disminúyalo.
4. Mostrar texto COMPRA/VENTA
true→ muestra tanto una flecha (↑/↓) como el texto “COMPRA” o “VENTA”.false→ solo flechas.
Si el gráfico se siente saturado, puede ocultar el texto y mantener solo las flechas.
🔍 Cómo se generan las señales (lógica)
Internamente el indicador:
- Lleva un registro de los dos máximos oscilantes más recientes y dos mínimos oscilantes más recientes:
-
_prevHigh,_lastHigh_prevLow,_lastLow
- A partir de estos verifica:
-
- ¿Los máximos y mínimos están ambos subiendo?
-
- → Tendencia alcista (
StructureTrendSignal.Bullish)
- → Tendencia alcista (
- ¿Los máximos y mínimos están ambos bajando?
-
- → Tendencia bajista (
StructureTrendSignal.Bearish)
- → Tendencia bajista (
- Si no están alineados, se mantiene la tendencia previa.
- Cada vez que cambia la tendencia estructural:
-
Bajista → Alcista→ señal de COMPRAAlcista → Bajista→ señal de VENTA
- También asegura:
-
- Que la tendencia no sea
Unknown(es decir, que no esté al principio). - Que hayan pasado suficientes barras desde la última señal (
MinBarsBetweenSignals).
- Que la tendencia no sea
Esto significa que cada flecha marca un verdadero cambio estructural, no ruido aleatorio.
📈 Cómo leer las señales COMPRA/VENTA en el gráfico
✅ Señal de COMPRA
Lo que ves:
- Una flecha hacia arriba
↑debajo de la vela - Opcionalmente el texto “COMPRA” cerca de la flecha
Lo que significa:
- La estructura cambió de bajista → alcista.
- Los máximos y mínimos oscilantes recientes están ahora ambos subiendo.
- El mercado probablemente está en transición hacia una nueva tendencia alcista o retomando la estructura alcista.
Cómo usarlo:
- Busque entradas largas:
-
- En la vela de señal o en las siguientes velas.
- Preferiblemente después de un pequeño retroceso a un nivel de soporte (mínimo oscilante previo, zona de demanda, VWAP, VA bajo, etc.).
- Use herramientas como Kalman Trend / EMA / Perfil de Volumen para filtrar:
-
- Solo tome COMPRA cuando el marco temporal mayor o Kalman también sea alcista.
✅ Señal de VENTA
Lo que ves:
- Una flecha hacia abajo
↓encima de la vela - Opcionalmente el texto “VENTA”
Lo que significa:
- La estructura cambió de alcista → bajista.
- Los máximos y mínimos oscilantes ahora están ambos bajando.
- El mercado probablemente está entrando en una tendencia bajista o retomando la estructura bajista.
Cómo usarlo:
- Busque entradas cortas:
-
- En la vela de señal o en las siguientes velas cerca de una resistencia.
- Ideal después de un retesteo de un soporte roto (ahora resistencia), VAH, zona de oferta, etc.
🎯 Usos prácticos en trading
1. Como herramienta de entrada independiente
Conjunto de reglas simples:
- Configuración de compra
-
- Espere una flecha de COMPRA.
- Coloque una orden larga en o cerca de la vela de señal.
- Stop loss debajo del mínimo oscilante reciente.
- Objetivo en el máximo oscilante previo o una resistencia clave.
- Configuración de venta
-
- Espere una flecha de VENTA.
- Coloque una orden corta en o cerca de la vela de señal.
- Stop loss encima del máximo oscilante reciente.
- Objetivo en el mínimo oscilante previo o soporte clave.
Este es el uso más básico y funciona mejor en H1, H4 y D1, donde la estructura es más clara.
2. Como herramienta de confirmación con otros indicadores
Aquí es donde se vuelve potente.
🔹 Con Kalman Filter Trend
- Solo tome señales de COMPRA cuando:
-
- La tendencia Kalman está inclinada hacia arriba y el precio está en o por encima de la línea Kalman.
- Solo tome señales de VENTA cuando:
-
- La tendencia Kalman está inclinada hacia abajo y el precio está en o por debajo de la línea Kalman.
Efecto:
Kalman te da una tendencia suave, MarketStructureOscSignals te da cambios estructurales precisos. Juntos filtran muchas malas operaciones.
🔹 Con Perfil de Volumen / Soporte y Resistencia
- Fuerte COMPRA:
-
- La flecha de COMPRA aparece cerca de VA Low, mínimo oscilante previo o barrido de liquidez, con rechazo.
- Fuerte VENTA:
-
- La flecha de VENTA aparece cerca de VA High, máximo oscilante previo o barrido de liquidez en la parte superior.
Aquí la señal no es solo un patrón técnico sino que también está anclada en zonas de liquidez y flujo de órdenes.
3. Para escalar entradas/salidas
También puede usar nuevas señales como:
- Puntos para escalar entrada
Agregar a una posición cuando aparece una nueva señal en la misma dirección que su operación existente y el marco temporal mayor está alineado. - Salida temprana / salida parcial
Si está en largo y aparece una señal de VENTA contra su posición (especialmente cerca de una estructura clave), puede: -
- Cerrar una parte de la posición
- O ajustar stops
🧪 Configuraciones recomendadas para comenzar
Para Forex H1 / H4:
Swing Left = 2Swing Right = 2Min Bars Between Signals = 3Arrow Offset = 5–10 pips
Para Índices M15 / H1:
Swing Left = 2–3Swing Right = 2–3Min Bars Between Signals = 5Arrow Offsetadaptado al símbolo (p. ej. 20–50 “pips” dependiendo del broker)
Para Crypto H1 / H4:
- Oscilantes ligeramente más altos para filtrar ruido:
-
Swing Left = 3Swing Right = 3Min Bars Between Signals = 4–6
Siempre haga backtest con su instrumento y marco temporal preferidos para ajustar finamente Swing y MinBarsBetweenSignals.
Resumen
Valoraciones de clientes
5 | 100 % | |
4 | 0 % | |
3 | 0 % | |
2 | 0 % | |
1 | 0 % |


