
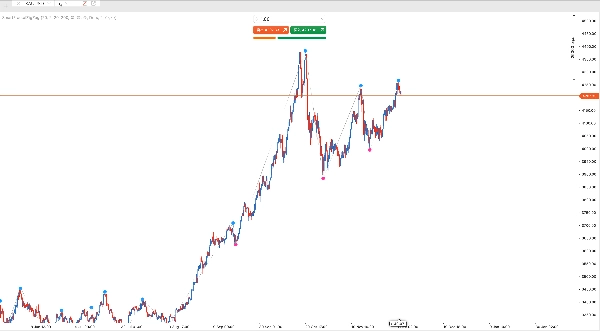
Description
# SmartFractalZigZag - La base de toute méthodologie de trading
## Aperçu du produit
**SmartFractalZigZag** n'est pas simplement un autre indicateur — c'est la **fondation structurelle** sur laquelle repose chaque méthodologie de trading sérieuse.
Que vous pratiquiez **Smart Money Concepts (SMC/ICT)**, **la théorie des vagues d'Elliott**, **la théorie de Dow**, **la méthode Wyckoff**, **la théorie Chan (缠论)**, ou toute forme d’**analyse de l’action des prix** — elles commencent toutes par une exigence fondamentale : **identifier précisément la structure du marché**.
Cet indicateur vous offre cette base avec **zéro recalcul**, **sensibilité personnalisable**, et **une sortie visuelle claire**.
---
## La fondation universelle : pourquoi la structure est importante
Chaque méthodologie de trading majeure est construite sur les mêmes éléments de base :
| Méthodologie | Comment ils l'appellent | Ce que SmartFractalZigZag montre |
|-------------|-------------------|-------------------------------|
| **Support/Résistance** | Niveaux clés | Sommets oscillants = résistance, creux oscillants = support |
| **SMC/ICT** | Swing High/Low, BOS, CHoCH | Points exacts des swings pour les ruptures de structure |
| **Théorie des vagues d'Elliott** | Pivots de vague | Points pivots clairs pour le comptage des vagues |
| **Théorie de Dow** | Sommets/creux plus hauts | Structure de tendance en un coup d'œil |
| **Wyckoff** | Springs, Upthrusts | Extrêmes de swing dans accumulation/distribution |
| **Théorie Chan (缠论)** | 笔 (Bi), 线段 | Structure personnalisable pour l'identification des 笔 |
| **Fibonacci** | Points d'ancrage | Points de swing précis pour retracement/extension |
| **Action des prix** | Structure de swing | Visualisation claire du rythme du marché |
**Un indicateur. Toutes les méthodologies. Une base solide.**
---
## Applications méthodologiques de trading
### Smart Money Concepts (SMC) / ICT
- **Break of Structure (BOS)** : Lorsque le prix casse un sommet/creux oscillant, la structure change
- **Change of Character (CHoCH)** : Première cassure opposée signalant un retournement potentiel
- **Analyse des blocs d'ordres** : Les points de swing définissent où chercher les OB
- **Zones Premium/Discount** : Utilisez la plage des swings pour le calcul des zones
**Astuce** : Utilisez Left=5, Right=3 pour la structure SMC intrajournalière ; Left=10, Right=5 pour l'analyse sur des unités de temps plus élevées.
### Théorie des vagues d'Elliott
- **Pivots de vague** : Chaque fractale marque un point de départ/fin potentiel de vague
- **Vagues impulsives** : Structure en 5 vagues clairement visible via la séquence des swings
- **Vagues correctives** : Les motifs ABC émergent des swings alternés
- **Degré de vague** : Ajustez les barres Left/Right pour voir différents degrés de vague
**Astuce** : Lancez plusieurs instances — une pour les vagues mineures (3/2), une pour les intermédiaires (10/5), une pour les primaires (20/10).
### Théorie de Dow
- **Confirmation de tendance haussière** : Série de sommets ET creux plus hauts
- **Confirmation de tendance baissière** : Série de sommets ET creux plus bas
- **Alerte de retournement de tendance** : Lorsque la séquence est rompue
- **Tendances primaires/secondaires** : Différents réglages de sensibilité révèlent différents niveaux de tendance
**Astuce** : Utilisez Left=10, Right=5 pour les tendances primaires ; Left=5, Right=3 pour les tendances secondaires/intermédiaires.
### Méthode Wyckoff
- **Phases d'accumulation** : Identifier les creux oscillants formant un support
- **Phases de distribution** : Identifier les sommets oscillants formant une résistance
- **Springs & Upthrusts** : Swings extrêmes qui échouent et se renversent
- **Analyse de la plage de trading** : Frontières claires à partir des extrêmes de swing
**Astuce** : Utilisez une sensibilité plus élevée (Left=5, Right=3) pour capter les springs/upthrusts ; une sensibilité plus faible (Left=10, Right=5) pour définir les limites de la plage de trading.
### Théorie Chan (缠论)
- **Identification des 笔 (Bi)** : Ajustez la sensibilité pour correspondre à votre définition de 笔
- **线段 (Segment de ligne)** : Sensibilité plus élevée pour la structure 线段
- **中枢 (Zhongshu)** : Les plages de swing qui se chevauchent définissent les zones de consolidation
- **背驰 (Divergence)** : Comparez les amplitudes des swings pour l'analyse de divergence
### Support & Résistance — L'application la plus directe
C'est le cas d'utilisation **le plus simple mais le plus puissant** — aucune théorie complexe requise.
**Chaque fractale est un niveau potentiel de S/R :**
- **Fractales haussières (sommets oscillants)** = Niveaux de résistance où les vendeurs sont intervenus
- **Fractales baissières (creux oscillants)** = Niveaux de support où les acheteurs sont intervenus
- **Testés plusieurs fois** = Niveaux plus forts et plus significatifs
- **Niveaux cassés** = Ancienne résistance devient nouveau support (et vice versa)
**Utilisation pratique :**
- Tracez des lignes horizontales à partir des points fractals pour étendre les S/R dans le futur
- Surveillez les réactions du prix à ces niveaux
- Combinez avec l'analyse du volume pour confirmation
- Utilisez pour le placement des stop-loss (en dessous du support / au-dessus de la résistance)
- Identifiez les opportunités de cassure/effondrement
**Astuce** : Des valeurs Left/Right plus élevées (ex. 10/5 ou 20/10) produisent moins de niveaux S/R mais plus significatifs. Des valeurs plus basses montrent des niveaux plus granulaires pour le scalping.
### Analyse Fibonacci
Les fractales fournissent les **points d'ancrage** pour les mesures Fibonacci — plus besoin de deviner où tracer.
**Retracements :**
- Du sommet oscillant au creux oscillant pour les retracements baissiers
- Du creux oscillant au sommet oscillant pour les retracements haussiers
- Niveaux clés : 38,2 %, 50 %, 61,8 %
**Extensions :**
- Utilisez trois fractales consécutives (A-B-C) pour les projections d'extension
- Niveaux cibles : 127,2 %, 161,8 %, 261,8 %
**Flux de travail pratique :**
1. Identifiez deux fractales significatives (un sommet, un creux)
2. Tracez l'outil Fibonacci de l'un à l'autre
3. Surveillez les réactions du prix aux niveaux Fib
4. Combinez avec d'autres fractales pour la confluence
**Astuce** : Utilisez des valeurs Left/Right plus élevées (10/5 ou plus) pour identifier les swings majeurs pour l'analyse Fibonacci. Les swings mineurs créent trop de niveaux.
---
## Guide de démarrage rapide
**Étape 1 : Ajouter au graphique**
- Trouvez SmartFractalZigZag dans les indicateurs
- Glissez-le sur votre graphique
**Étape 2 : Choisissez votre style**
| Votre style | Barres à gauche | Barres à droite | Ce que vous verrez |
|------------|-----------|------------|-----------------|
| Scalper | 3 | 2 | Beaucoup de petits swings |
| Day Trader | 5 | 3 | Structure intrajournalière |
| Swing Trader | 10 | 5 | Swings majeurs (par défaut) |
| Position Trader | 20 | 10 | Structure macro uniquement |
**Étape 3 : Interprétez les signaux**
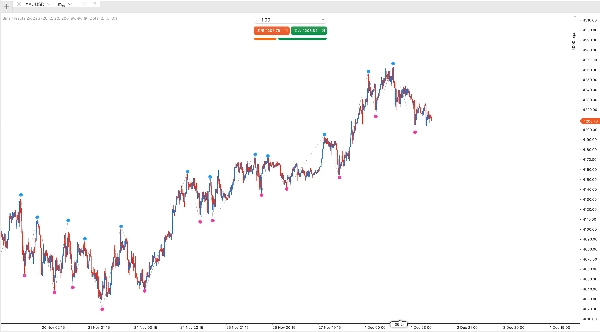
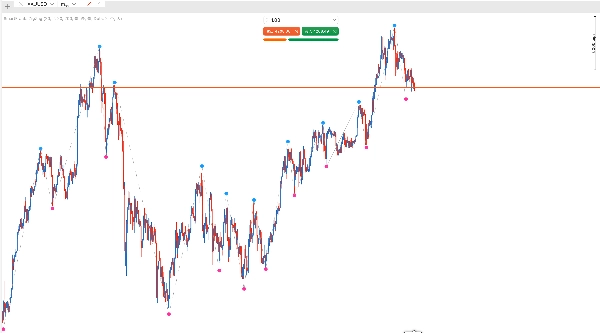
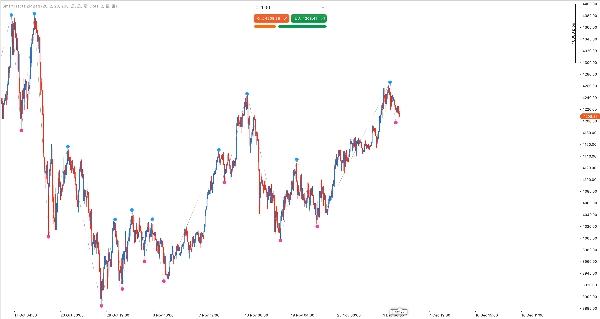
- **Points bleus au-dessus des chandeliers** = Sommets oscillants (résistance potentielle)
- **Points roses sous les chandeliers** = Creux oscillants (support potentiel)
- **Lignes ZigZag** = Connexion visuelle des swings
**Étape 4 : Appliquez à votre trading**
- **Trading S/R** : Tracez des lignes horizontales à partir des points fractals
- **Trading de tendance** : Cherchez des sommets/creux plus hauts (tendance haussière) ou plus bas (tendance baissière)
- **Fibonacci** : Utilisez les fractales comme points d'ancrage pour les outils de retracement/extension
- **Reconnaissance de motifs** : Repérez les doubles sommets, têtes et épaules, etc.
**Conseils de pro :**
- Lancez plusieurs instances avec des réglages différents pour voir à la fois la micro et la macro structure
- Désactivez ZigZag si vous avez seulement besoin des points fractals
- Ajustez le décalage fractal si les points se superposent aux chandeliers
---
## Fonctionnalités clés
### 1. ZÉRO RECALCUL — L'incontournable
**C'est la fonctionnalité la plus critique.**
90 % des indicateurs fractal/ZigZag recalculent. Les signaux apparaissent, disparaissent et bougent. Vos backtests montrent des entrées "parfaites" qui n'ont jamais existé en temps réel.
**Garantie SmartFractalZigZag :**
- Les fractales ne sont confirmées qu'après la fermeture de toutes les barres à droite
- Une fois dessinée, une fractale NE change JAMAIS de position
- Les signaux historiques sont fiables à 100 %
- Les résultats des backtests = résultats du trading en direct
- Sûr pour l'intégration cBot/trading automatisé
**Principe technique** : Une fractale à la barre N est confirmée uniquement lorsque la barre N+RightBars est complètement fermée. Aucune exception.
### 2. Sensibilité de structure personnalisable
**Barres gauche/droite** contrôlent à quel point un swing doit être "significatif" :
| Style de trading | Réglages suggérés | Cas d'utilisation |
|---------------|-------------------|----------|
| Scalping | Left=3, Right=2 | Micro-structure, retournements rapides |
| Day Trading | Left=5, Right=3 | Swings intrajournaliers |
| Swing Trading | Left=10, Right=5 | Structure multi-jours |
| Position Trading | Left=20, Right=10 | Structure majeure du marché |
**Puissance multi-instance** : Lancez 2-3 instances avec des réglages différents pour voir simultanément la micro, méso et macro structure sur un même graphique.
### 3. Filtrage intelligent des mêmes directions — Éliminer le bruit et les faux signaux
C'est une **fonctionnalité critique** qui distingue SmartFractalZigZag des indicateurs fractals ordinaires.
**Le problème avec les fractales traditionnelles :**
Les indicateurs fractals traditionnels affichent TOUS les points fractals qualifiés. Sur les marchés en tendance, cela crée :
- Plusieurs fractales consécutives dans la même direction (ex. 5 fractales haussières d'affilée lors d'une tendance haussière)
- Un encombrement visuel qui masque la vraie structure du marché
- De faux signaux — toutes les fractales ne sont pas des points de retournement significatifs
- Des lignes ZigZag qui sautent de manière erratique entre les swings mineurs
- Difficulté à identifier les vrais niveaux de support/résistance
**Solution SmartFractalZigZag — Filtrage extrême par intervalle :**
L'indicateur filtre intelligemment les fractales dans la même direction, ne conservant que l'EXTRÊME VRAI :
- **Fractales haussières** : Seul le plus HAUT sommet parmi les fractales haussières consécutives est conservé
- **Fractales baissières** : Seul le plus BAS creux parmi les fractales baissières consécutives est conservé
- **Alternance stricte** : Chaque fractale haussière est suivie d'une fractale baissière, et vice versa
- **Garantie d'extrême par intervalle** : Chaque fractale conservée représente le véritable extrême entre deux fractales de direction opposée
**Pourquoi c'est important :**
| Sans filtrage | Avec filtrage intelligent |
|-------------------|---------------------|
| Beaucoup de points, chaos visuel | Points propres et minimaux |
| Chaque swing mineur affiché | Seulement les swings significatifs |
| Faux niveaux S/R | Niveaux S/R fiables |
| Lignes ZigZag bruyantes | ZigZag lisse et significatif |
| Difficile d'identifier la structure | Structure en un coup d'œil |
**Avantages pour le trading :**
1. **Graphiques plus propres** : Concentrez-vous sur l'essentiel, pas sur le bruit
2. **S/R fiable** : Chaque fractale est un extrême réel, pas une fluctuation mineure
3. **Meilleur comptage des vagues** : Pivots clairs pour l'analyse des vagues d'Elliott
4. **BOS/CHoCH précis** : Vraies ruptures de structure, pas de faux signaux
5. **Fibonacci fiable** : Points d'ancrage représentant de vrais swings
**Flexibilité** : Si vous préférez voir TOUTES les fractales (pour des besoins d'analyse spécifiques), désactivez simplement le Filtre Consécutif. Mais pour la plupart des traders, la vue filtrée offre des signaux plus propres et exploitables.
**Résultat** : Moins de points, swings plus clairs, niveaux fiables et structure de marché authentique.
### 4. Intégration Fractal + ZigZag
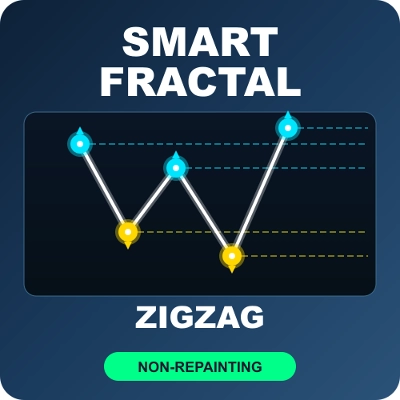
- **Points fractals** : Marquez les sommets et creux oscillants exacts
- **Lignes ZigZag** : Reliez les swings pour un flux visuel
- **Affichage décalé** : Les fractales flottent au-dessus/en dessous des chandeliers sans masquer le prix
- **Bascule indépendante** : Affichez uniquement les fractales, uniquement ZigZag, ou les deux
---
## Paramètres
### Réglages fractals
- **Barres à gauche** : Nombre de barres à gauche pour la comparaison (par défaut : 10)
- **Barres à droite** : Nombre de barres à droite pour la confirmation (par défaut : 5)
### Réglages d'affichage
- **Taille fractale** : Taille du point fractal (par défaut : 20, plage : 5-60)
- **Décalage fractal** : Distance par rapport au prix en points (par défaut : 50)
- **Couleur fractale haut/bas** : Couleurs personnalisables
- **Afficher les fractales** : Activer/désactiver l'affichage des fractales
### Réglages ZigZag
- **Activer ZigZag** : Activer/désactiver les lignes ZigZag
- **Couleur/style/épaisseur ZigZag** : Personnalisation complète
### Réglages de filtrage
- **Filtrer consécutifs** : Filtrage intelligent des mêmes directions (par défaut : activé)
### Autres réglages
- **Forcer nettoyage de toutes les instances** : Efface tous les objets de l'indicateur sur le graphique
---
## Pourquoi choisir SmartFractalZigZag ?
1. **Méthodologie agnostique** : Fonctionne avec SMC, Elliott, Dow, Wyckoff, théorie Chan, et plus encore
2. **Zéro recalcul** : Construisez votre analyse sur la vérité, pas sur la fiction
3. **Sensibilité personnalisable** : Adaptez l'indicateur à VOTRE style de trading
4. **Support multi-instance** : Visualisez plusieurs niveaux de structure simultanément
5. **Sortie propre** : Le filtrage intelligent élimine le bruit, ne montre que l'essentiel
6. **Qualité professionnelle** : Code robuste avec gestion complète des cas limites
7. **Prêt pour l'automatisation** : Signaux fiables pour l'intégration cBot
---
### Clarification : Filtrage des mêmes directions et remplacement visuel
- Le filtrage intelligent des mêmes directions conserve uniquement le point le plus extrême parmi les candidats consécutifs dans la même direction (plus hauts pour la hausse, plus bas pour la baisse).
- Jusqu'à l'apparition d'une fractale dans la direction opposée, un point précédemment dessiné dans la même direction peut être remplacé visuellement par un point plus extrême. Il s'agit d'un filtrage intentionnel, pas d'une fuite de données futures, et utilise uniquement des barres complètement fermées.
- Vous souhaitez absolument aucun remplacement visuel ? Désactivez le Filtre Consécutif pour afficher chaque fractale qualifiée (plus de points, plus de bruit).
Résumé
Key features include zero repainting—fractals confirm only after a set number of bars close, ensuring signals do not change retrospectively—and customizable sensitivity through adjustable left and right bar parameters to match different trading styles from scalping to position trading. The indicator employs smart same-direction filtering to reduce noise by preserving only the most extreme fractal in consecutive swings, resulting in cleaner charts and more reliable support/resistance levels.
SmartFractalZigZag integrates fractal points with ZigZag lines for visual clarity, with options to toggle each independently. It facilitates applications such as break of structure (BOS), change of character (CHoCH), order block analysis, Fibonacci retracement and extension anchoring, and pattern recognition. Multiple instances can run simultaneously to display micro to macro market structures. The indicator is suitable for markets including Forex, indices, commodities, stocks, and cryptocurrencies.




![Logo de "[Stellar Strategies] VBO"](https://cdn.ctrader.com/image/webp/f034c012-94d4-445a-a01b-febd1cdedaef_36944)











![Logo de "[Hamster-Coder] Bollinger Bands"](https://cdn.ctrader.com/image/webp/21d8e5d6-fb11-4bac-b9ee-cd05c2b76804_30327)
