
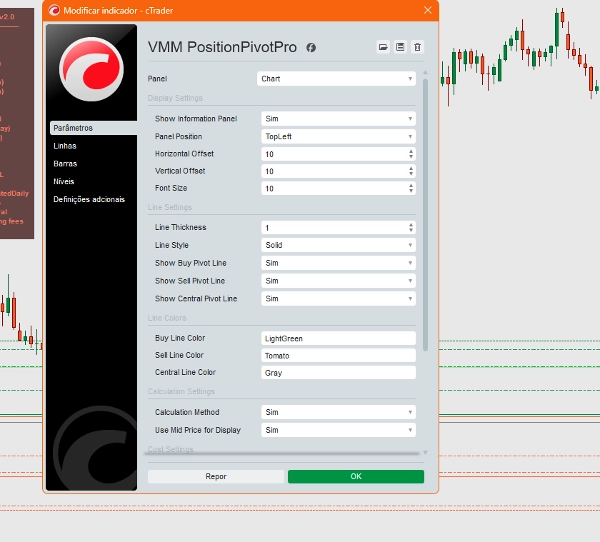
VMM PositionPivotPro
Indicador
Versión 2.0, Jan 2026
Windows, Mac
Descripción
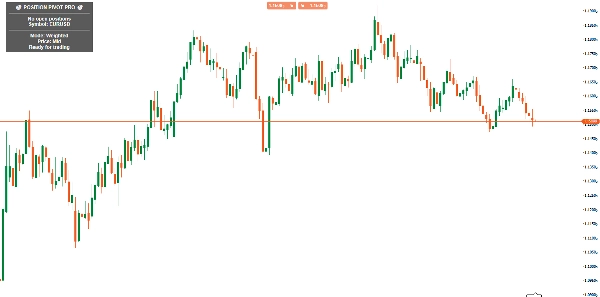
Position Pivot Pro es una herramienta avanzada de gestión de posiciones diseñada para traders que operan múltiples entradas en el mismo activo. El indicador calcula automáticamente el punto pivote promedio de todas las posiciones abiertas, proporcionando una referencia visual crucial en el gráfico.
Características clave:
- Cálculo de pivote en tiempo real:
-
- Promedio simple: Media aritmética de los precios de entrada
- Promedio ponderado por volumen: (Por defecto) Considera el volumen de cada posición para pivotes más precisos
- Línea dinámica en el gráfico que se ajusta automáticamente
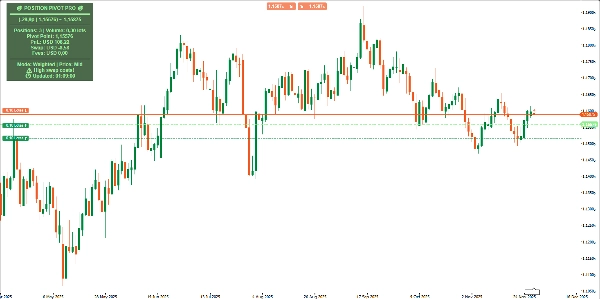
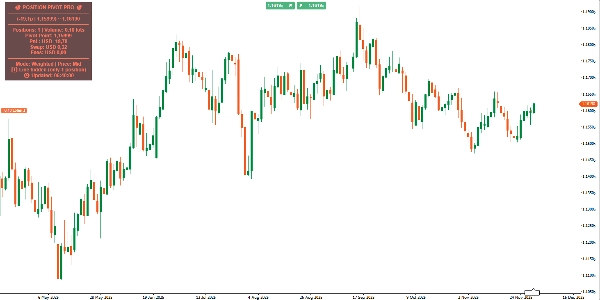
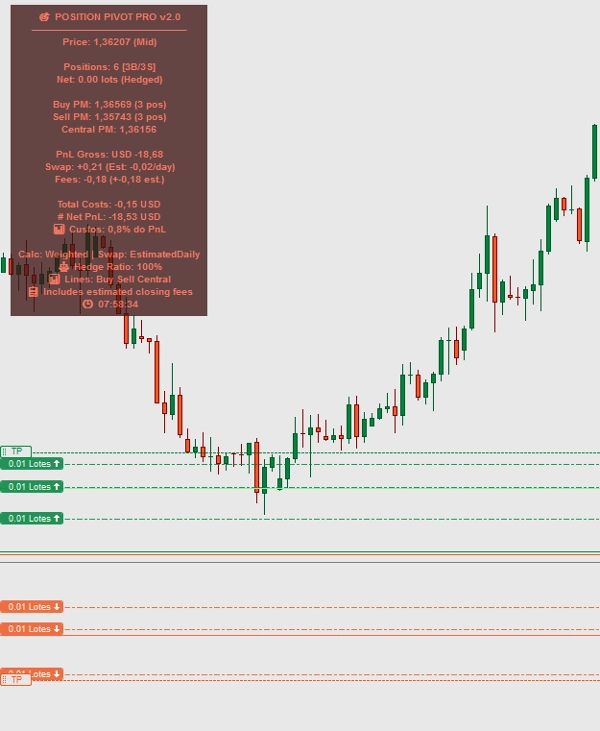
- Panel de información completo:
-
- Muestra el punto pivote calculado
- Muestra la fuerza del movimiento en pips (distancia desde el precio actual)
- Posiciones totales y volumen en lotes
- P&L no realizado, swap acumulado y comisiones totales
- Sistema de alerta de costos:
-
- Alertas visuales cuando las comisiones o el swap superan los límites configurables
- Advertencias por costos absolutos altos
- Colores dinámicos (verde/ganancia, rojo/pérdida, neutral)
- Características técnicas:
-
- Cero retardo: Cálculos en tiempo real sin demoras
- Totalmente personalizable: Posición del panel, colores, grosor de línea
- Modo precio Mid/Bid: Elige la referencia de cálculo
- Actualizaciones automáticas con cambios en la posición
Beneficios para el trader:
- Toma de decisiones más rápida con vista consolidada de todas las posiciones
- Mejora en la gestión de riesgos identificando puntos de equilibrio
- Optimización de costos con monitoreo de swap y comisiones
- Análisis de fuerza del movimiento relativo al pivote
Casos de uso:
- Escalado in/out: Identifica el precio promedio ideal para añadir/reducir posiciones
- Gestión de cobertura: Monitorea posiciones opuestas simultáneamente
- Trading de tendencia: Sigue el desarrollo de entradas graduales
- Trading intradía: Control preciso de múltiples operaciones intradía
Perfecto para traders que usan estrategias de pirámide, martingala o entradas múltiples, transformando datos complejos en información accionable directamente en el gráfico.
Resumen
Perfil del indicador
Valoraciones de clientes
0.0
Valoraciones: 0
Valoraciones de clientes
Este producto todavía no se ha valorado. ¿Ya lo ha probado? Sea el primero en informar a otros.
Conversación
Preguntas frecuentes
BTCUSD
Forex
Indices
EURUSD
Commodities
GBPUSD
NZDUSD
Crypto
Stocks
XAUUSD
NAS100
USDJPY
Los productos disponibles a través de cTrader Store, incluidos bots, indicadores y plugins para operar, son proporcionados por desarrolladores de terceros y están disponibles únicamente con fines informativos y de acceso técnico. cTrader Store no es un bróker, por lo que no proporciona asesoramiento de inversión, recomendaciones personales ni ninguna garantía de rentabilidad futura.
Más de este autor


![Logotipo de "[Stellar Strategies] Smart ADX"](https://cdn.ctrader.com/image/webp/af13b084-b6f6-41db-b7bc-c7e688b57b05_36929)
![Logotipo de "[Hamster-Coder] Pivot Points MTF"](https://cdn.ctrader.com/image/webp/4c143e5a-309c-40e3-a578-f04d1e133ffa_31159)


Precio
Desde 28/12/2024
54
Instalaciones gratis