
Descripción
Oscilador Super Trend
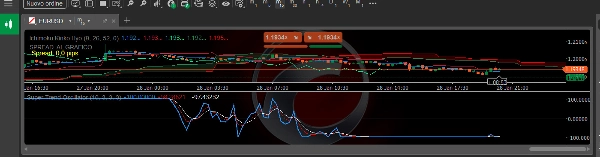
Oscilador Super Trend – Indicador cTrader
Descripción
El Oscilador Super Trend es un indicador propietario de impulso y fuerza de tendencia diseñado para cTrader, construido para transformar el concepto clásico de SuperTrend en un oscilador suave y centrado.
Al combinar la lógica SuperTrend basada en ATR con un suavizado EMA multinivel, este indicador proporciona una visión clara de la dirección del mercado, la aceleración del impulso y la calidad de la tendencia, haciéndolo ideal para scalping y trading a corto plazo en marcos temporales bajos como M1.
A diferencia de los indicadores de tendencia tradicionales, el Oscilador Super Trend oscila alrededor de una línea cero, permitiendo a los traders identificar fácilmente la presión alcista y bajista, los cambios de impulso y las posibles continuaciones o desaceleraciones de la tendencia.
Cómo Funciona
- Utiliza cálculo SuperTrend basado en ATR para definir la dirección dinámica del mercado.
- Convierte la distancia entre el precio y SuperTrend en un oscilador normalizado.
- Aplica suavizado doble EMA para reducir el ruido mientras preserva una reacción rápida a los movimientos de precio.
- Los valores están centrados alrededor de 0, con un rango controlado para una interpretación visual consistente.
Características Clave
- 📊 Oscilador Centrado (rango ±100)
Visualización clara del impulso alcista/bajista. - ⚡ Rápido y Receptivo
Optimizado para marcos temporales bajos y condiciones de mercado de alta frecuencia. - 🧠 Híbrido de Tendencia + Impulso
Combina la dirección de la tendencia con la fuerza del impulso en un solo indicador. - 🎯 Estructura Multi-Línea
Línea principal del oscilador con líneas de señal y suavizado lento para confirmación. - 🔄 No Re-pintado
Utiliza solo cálculos de barras cerradas.
Aplicaciones de Trading
- Confirmación de tendencia en marcos temporales M1–M5
- Filtro de impulso para sistemas de trading automatizados (cBots)
- Estrategias de scalping y trading intradía
- Temporización de entrada y validación de fuerza de tendencia
Mejor Usado Con
- Estrategias de tendencia basadas en EMA
- Sistemas de acción del precio y rupturas
- Bots de trading automatizados que requieren un filtro de impulso
Aviso Legal
Este indicador es una herramienta de análisis técnico y no garantiza ganancias. Siempre pruebe y optimice según su estilo de trading y reglas de gestión de riesgo.
Resumen
Valoraciones de clientes
5 | 100 % | |
4 | 0 % | |
3 | 0 % | |
2 | 0 % | |
1 | 0 % |


![Logotipo de "[Hamster-Coder] Pivot Points MTF"](https://cdn.ctrader.com/image/webp/4c143e5a-309c-40e3-a578-f04d1e133ffa_31159)


