説明
何をするか
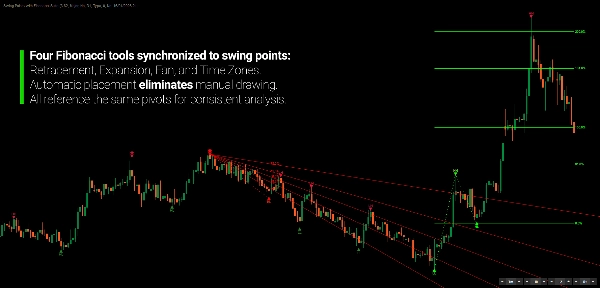
統一されたスイング検出から4つのフィボナッチツールを自動描画し、主観性を排除し、リトレースメント、エクスパンション、ファン、タイムゾーン全体で内部整合性を維持します。
手動のフィボナッチ描画は強力ですが主観的です。異なるトレーダーは同じチャート上で異なるレベルを描きます。自動化されたフィボナッチツールは通常、リトレースメントかエクスパンションかファンのいずれか一つの分析タイプを提供し、複数のインジケーターを追加するか、残りを手動で描く必要があります。
このインジケーターは4つのフィボナッチツールを単一のシステムに統合します。
リトレースメント、エクスパンション、ファン、タイムゾーンはすべて同じスイング検出ロジックから自動計算されます。新しい構造的なピボットが形成されると、4つのツールすべてがリアルタイムで更新され、同じスイングポイントに固定されます。手動描画なし。解釈のばらつきなし。ツール間の切り替えなし。
結果として、内部整合性を維持した包括的なフィボナッチ分析が得られます。
なぜ自動化されたフィボナッチが重要か
フィボナッチ分析は、市場が自然にリトレースし拡張する様子を反映しているため広く使われています。黄金比は価格構造に一貫して現れ、フィボナッチレベルはサポート、レジスタンス、予測ターゲットの貴重な参照点となります。
問題点
手動のフィボナッチ分析には3つの実際的な課題があります:
- 主観性 — トレーダーごとに異なるスイングポイントを選択する
- 時間消費 — 複数の時間枠で4つのツールを描くには多大なチャート作業が必要
- 一貫性の欠如 — スイングA-Bからのリトレースメント、B-Cからのエクスパンション、C-Dからのファンは切り離された分析を生む
実際には、自動フィボナッチツールは時間の問題を解決することが多いですが、それでも切り離されたスイングロジックに依存しています。リトレースメントは自動で描かれますが、エクスパンションやファンは異なるスイングから手動で配置する必要があります。
解決策
このインジケーターは4つのフィボナッチツールすべてを単一の共有スイングモデルに適用します。アルゴリズムがスイングポイントA、B、Cを特定すると:
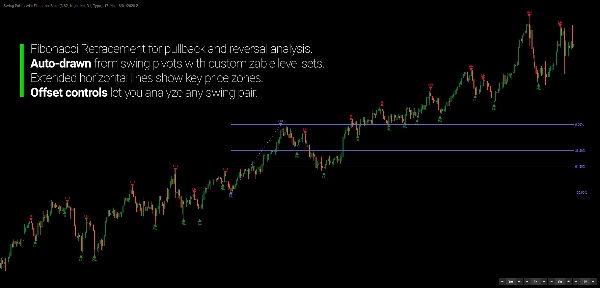
- リトレースメントは最新のスイングペアから描画されます
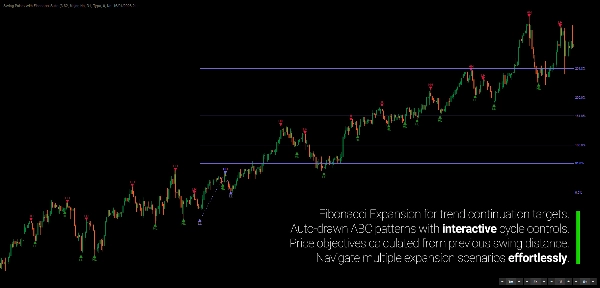
- エクスパンションは3スイング構造に基づいて投影されます
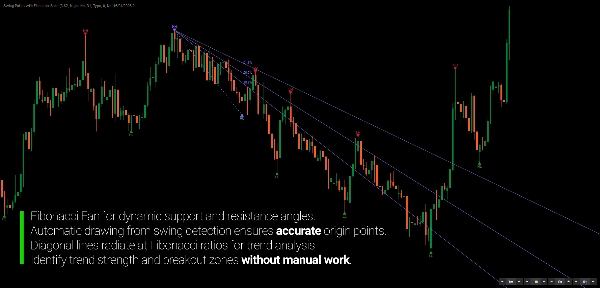
- ファンはアンカースイングから放射されます
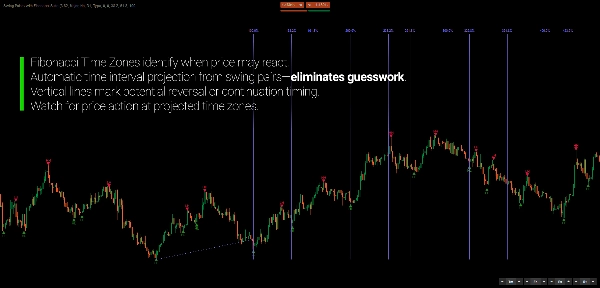
- タイムゾーンは基準スイングからの時間間隔を示します
各ツールは同じ構造的ピボットを参照し、すべてのフィボナッチビューで分析全体の内部整合性を保ちます。
コアコンセプト
スイング検出
このインジケーターは回帰法を用いて価格動向を平滑化し、構造的ピボットポイントを特定します。単純な価格の極値やインジケーターのクロスオーバーとは異なり、回帰は一時的なボラティリティではなく真のトレンド変化を反映するピボットを生成します。
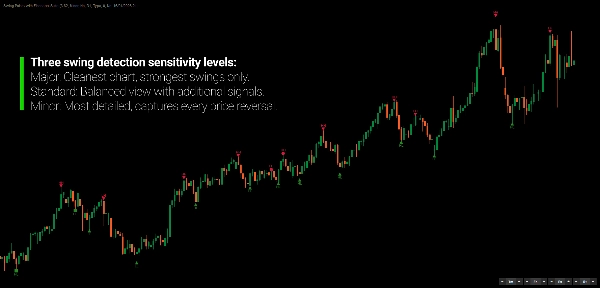
感度を制御する3つの検出モードがあります:
- メジャー — 最も厳格なフィルターで、主要な市場構造のピボットのみを特定
- スタンダード — スイングトレードの時間枠に適したバランスの取れたアプローチ
- マイナー — 大きなトレンド内のカウンタートレンドスイングを含み、詳細な分析を可能に
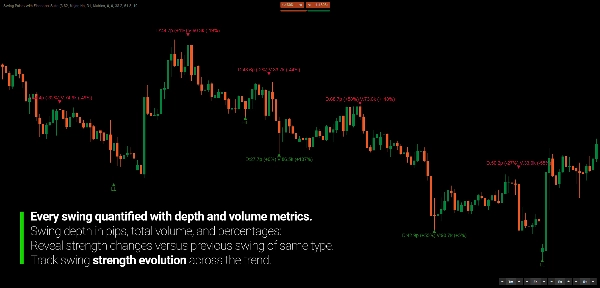
各スイングは(HH、HL、LH、LL)に分類され、オプションで深さ、出来高、期間、効率、吸収、確信度の指標がラベル付けされます。比較パーセンテージは現在のスイング強度が同タイプの過去のスイングとどのように関連しているかを示します。
フィボナッチ統合
スイングが検出されると、4つのフィボナッチツールが自動的に描画されます:
- リトレースメント — 最新のスイングペアからの水平レベル
- エクスパンション — ABC構造に基づく価格予測
- ファン — アンカーポイントからの斜めトレンドチャネル
- タイムゾーン — フィボナッチ間隔を用いた垂直時間予測
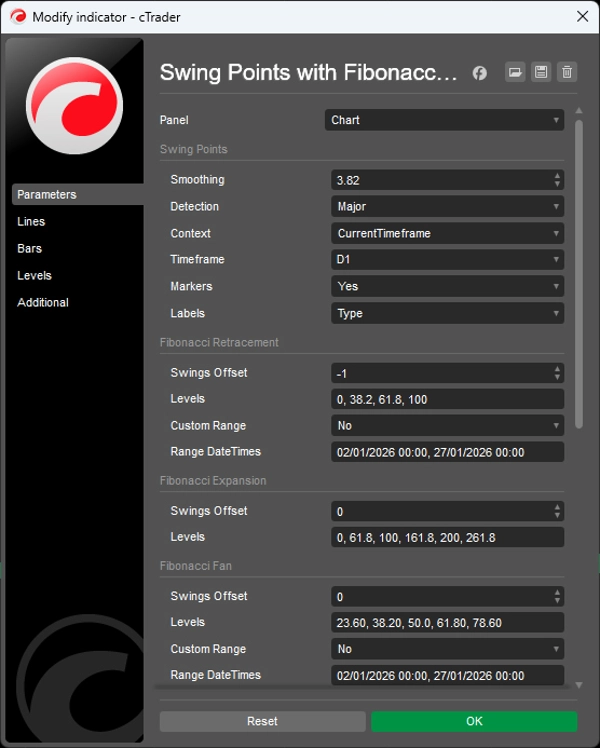
各ツールはチャート上のボタンで独立したオフセット制御が可能です。手動で再計算や再描画することなく、どのスイングペアが各分析タイプを駆動するかを調整できます。
4つのツールすべては カスタムレンジモードでも動作可能で、検出されたスイングの代わりに正確な開始/終了時間を指定できます。特定の市場イベントやセッションの分析に便利です。
マルチタイムフレームコンテキスト
インジケーターは高い時間枠でスイングを検出しながら、現在のチャートに表示できます。H1チャート上で日足のスイングとそのフィボナッチレベルを時間枠を切り替えずに表示可能です。
これにより、実行チャート上で高い時間枠の構造的コンテキストを提供し、より広範な市場方向性に合わせたエントリーを支援します。
主な特徴
スイング検出
- 構造的ピボット特定のための回帰フィルタリング
- 3つの検出モード:メジャー(主要構造)、スタンダード(スイングトレード)、マイナー(詳細な内部スイング)
- マルチタイムフレーム機能 — 高いTFでスイングを検出し、低いTFチャートに表示
- スイング分類 — HH/HL/LH/LLラベルでトレンド構造を確認
- 3種類のマーカー — 三角形(確定)、円(状態のみ)、四角形(内部スイング)
フィボナッチツール
- リトレースメント — 9つの設定可能なレベル(0%〜100%)
- エクスパンション — 8つの予測レベル(0%〜261.8%)
- ファン — 5つの斜めチャネル(23.6%〜78.6%)
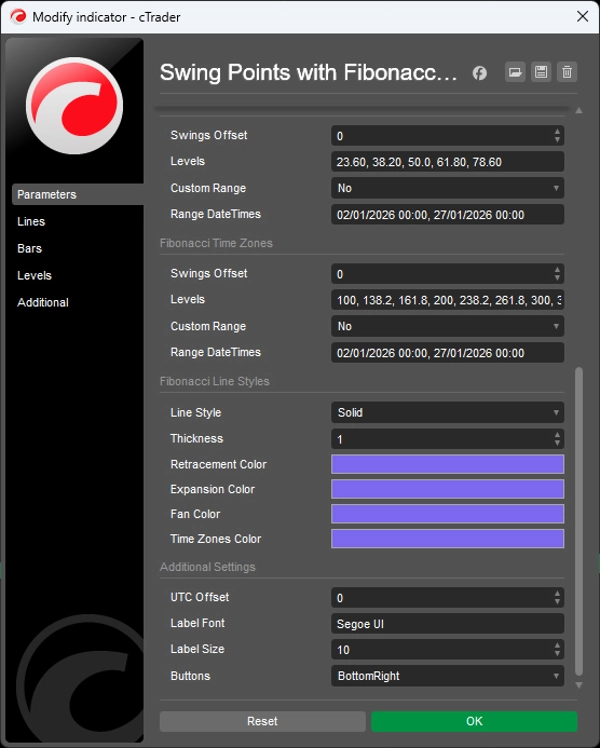
- タイムゾーン — 9つの時間間隔(100%〜322.8%)
- 各ツールの独立したオフセット制御をチャート上のUIボタンで操作可能
- カスタムレンジモード — 手動の日時範囲でスイング検出を上書き可能
スイング指標
- 基本指標 — 深さ(ピップス)、出来高(ティックボリューム)、期間(バー数)
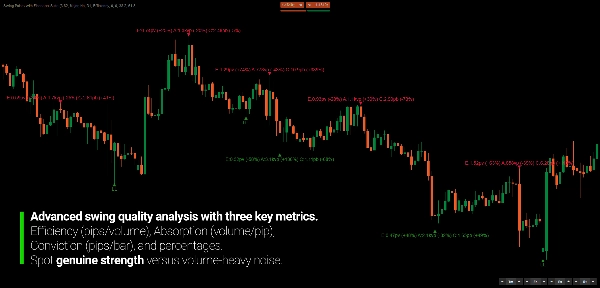
- 効率比率 — 効率(ピップス/ボリューム)、吸収(ボリューム/ピップス)、確信度(ピップス/バー)
- 比較分析 — 同タイプの前回スイングとのパーセンテージ変化
対象ユーザー
このインジケーターは、フィボナッチを単独のシグナルではなく構造的参照として使用するトレーダー向けに設計されています。
フィボナッチのリトレースメント、エクステンション、タイムゾーンを定期的に描く場合、このツールはそのプロセスを体系化します。異なるスイングにまたがって複数のツールを手動で配置する代わりに、同じ構造的参照点から4つすべてを同時に維持します。
複数の時間枠を分析し、実行チャート上で高時間枠の構造を見たいスイングトレーダーやポジショントレーダーに適しています。フィボナッチに焦点を当てるトレーダーは、リトレースメント、エクスパンション、ファン、時間分析が単一のフレームワークで統合されていることから恩恵を受けます。
マルチタイムフレーム分析者は、ウィンドウを切り替えずに日足や週足のスイングを日中チャートに表示でき、テクニカルアナリストは通常手動計算が必要なスイング指標(効率、吸収、確信度)にアクセスできます。
これはエントリーシグナルシステムではありません。市場コンテキストでフィボナッチを解釈するための構造的フレームワークであり、手動チャート作業の負担を減らしつつ、フィボナッチツールの価値を高める分析の深さを維持します。
何が違うのか
複数のフィボナッチツールを適用する場合、通常は複数のスイング解釈を扱います。統一された構造的参照なしにリトレースメント、エクスパンション、ファン、時間予測を組み合わせると、切り離された視点となり、一貫したフレームワークになりません。
このインジケーターは4つのツールすべてを単一のスイング検出アルゴリズムの下に統合します。各フィボナッチビューは同じ構造的ピボットに基づいて構築されており、異なる予測が同じ基盤となる市場コンテキストを反映することを保証します。
回帰アプローチは短期のボラティリティをフィルタリングしつつ構造的関連性を保持します。メジャーモードは主要な市場ピボットのみを特定し、マイナーモードは大きなスイング内の詳細なカウンタートレンド構造を明らかにします。同じアルゴリズムで感度が異なります。
マルチタイムフレーム機能により、チャートの切り替えなしに高時間枠のコンテキストを実行チャートに持ち込みます。H1チャートで日足スイングとその完全なフィボナッチ分析を確認できます — あなたの取引時間枠での構造的コンテキスト。
独立したオフセット制御により、複数のスイング構造を同時に分析可能です。最新のスイングからのリトレースメントと前のセットアップからのエクスパンション。すべてチャート上のボタンで制御され、パラメータパネルの調整は不要です。
---
市場構造におけるフィボナッチの理解
フィボナッチ比率は金融市場を含む自然界のシステム全体に現れます。リトレースメントが38.2%、50%、61.8%のレベル近くで停滞し、エクステンションが127.2%や161.8%の予測に達する傾向は、神秘的な性質ではなく基礎となる市場の幾何学を反映しています。
これらのレベルはある程度自己成就的です — 多くのトレーダーが注目し注文フローに影響を与えます — しかし時間枠や銘柄を超えて持続することは、より構造的な何かを示唆しています。
実用的な観点から、フィボナッチレベルは客観的な参照点を提供し、そうでなければ主観的なチャート分析において、プルバックでどこにサポートが形成されるかを推測する代わりに、特定の価格ゾーンを監視できます。
問題はフィボナッチが機能するかどうかではなく、どのように適用するかの一貫性を保つことです。手動分析はばらつきを生みます:どのスイングから測定するか?ヒゲか終値か?複数のスイングペアからの重複リトレースメントはどう扱うか?
体系的な適用はこれらの疑問を排除します。アルゴリズムは毎回同じ基準でスイングを選択し、4つのツールすべてが同じピボットを参照します。分析は異なる市場状況でも再現可能で比較可能になります。
これにより裁量がなくなるわけではありません — どのスイングオフセットを分析するか、セットアップに重要なレベルはどれか、ツール間の合流をどう解釈するかは依然としてあなたが決めます。しかし、その裁量のための一貫した基盤を確立します。
---
取引にはリスクが伴います。このインジケーターはテクニカル分析ツールであり、常に適切なリスク管理を適用してください。


