
Dominator M4tr1x
Esta es una herramienta informativa básica que combina el análisis de la estructura de precios del dinero inteligente en el gráfico con múltiples paneles de información. Aquí hay un desglose de cada sistema principal:
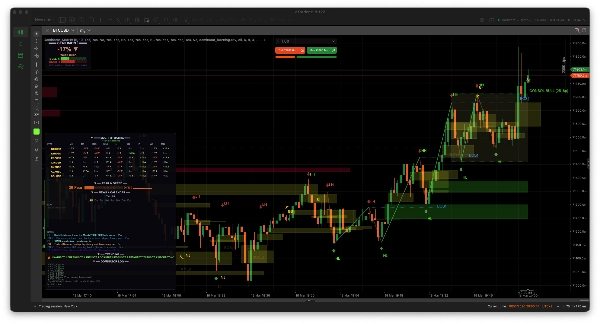
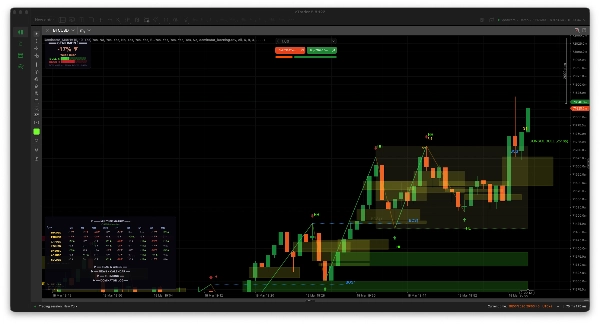
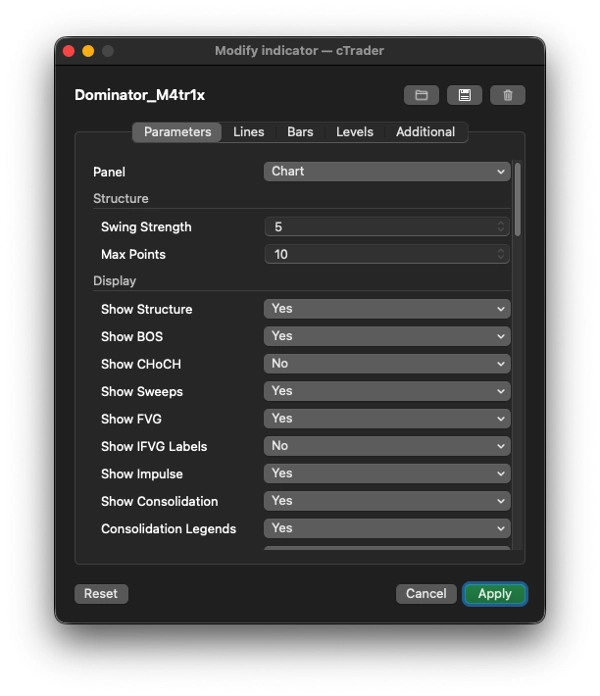
1. 📊 EN EL GRÁFICO: Análisis de la Estructura del Dinero Inteligente
Dibuja directamente en el gráfico de precios:
Característica
Qué hace ;
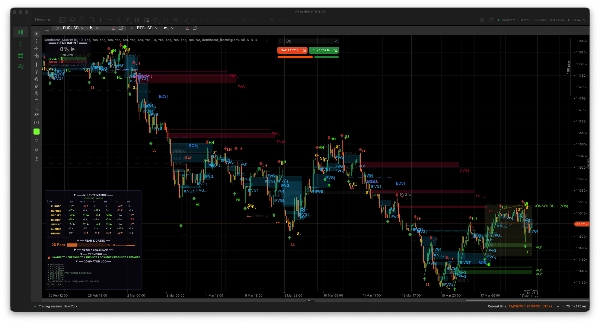
Detección de oscilaciones
Identifica máximos/mínimos de oscilación usando una fuerza de retroceso configurable, los marca con flechas (▲/▼)
Etiquetas de estructura
Etiqueta cada oscilación como HH (Higher High), HL (Higher Low), LH (Lower High), LL (Lower Low) para mapear la estructura del mercado
BOS (Ruptura de Estructura)
Dibuja líneas punteadas + etiquetas cuando el precio rompe un máximo/mínimo de oscilación previo en la dirección de la tendencia
CHoCH (Cambio de Carácter)
Igual que BOS pero en contra de la tendencia — señala una posible reversión de tendencia
Invalidación de ruptura
Si el precio revierte a través de un nivel BOS/CHoCH, lo marca como fallido (gris con ✗) y lo registra
Barridos de liquidez
Detecta cuando el precio hace mechas por encima de un máximo de oscilación (o por debajo de un mínimo) pero cierra dentro — un patrón clásico de captura de liquidez
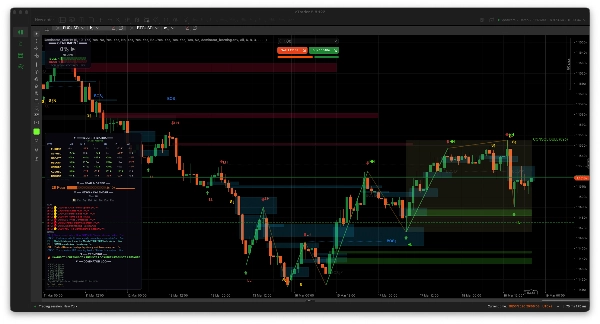
FVG (Brechas de Valor Justo)
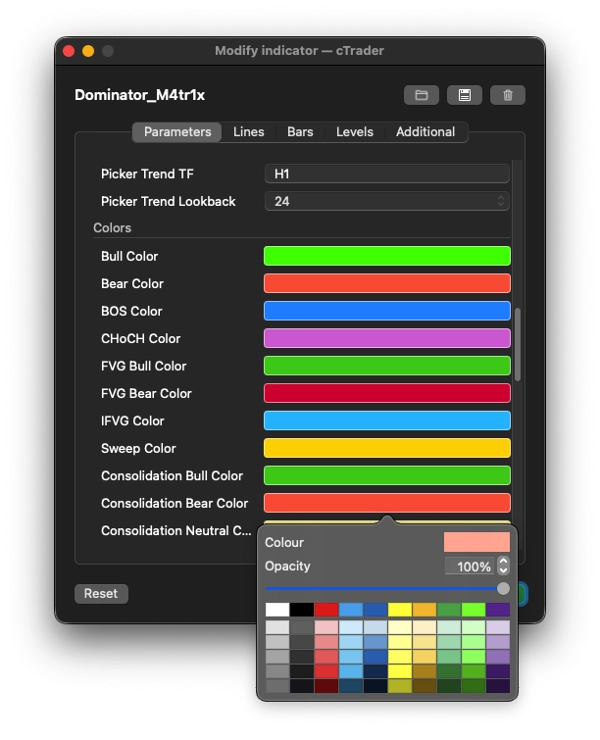
Detecta desequilibrios de 3 velas (brechas entre el máximo de la vela 1 y el mínimo de la vela 3). Dibuja rectángulos coloreados en el gráfico
IFVG (FVG Invertido)
Cuando el precio regresa a llenar un FVG, lo etiqueta como "IFVG" (la brecha se convierte en una posible zona de soporte/resistencia)
Invalidación de FVG
Si el precio cierra decisivamente a través de una zona FVG, se marca como invalidada
Ondas de impulso
Conecta puntos de oscilación con líneas de tendencia — verde para tramos de impulso (con la tendencia), amarillo para tramos correctivos
Zonas de consolidación
Detecta cuando máximos y mínimos consecutivos están dentro de un rango estrecho basado en ATR, dibuja un cuadro con una etiqueta "CONSOL BULL/BEAR/NEUTRAL" mostrando la dirección y el ancho en pips
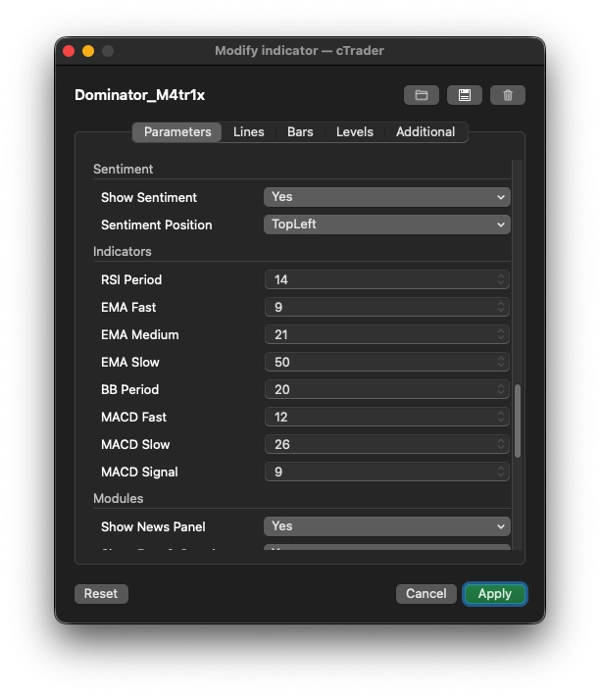
2. 📈 PANEL DE SENTIMIENTO (arriba a la izquierda por defecto)
Un medidor de puntuación alcista/bajista en tiempo real para el símbolo/marco temporal actual usando:
- RSI (sobrevendido/sobrecomprado + detección de divergencias)
- MACD (cruces, impulso del histograma)
- 3 EMAs (alineación rápida/media/lenta y posición del precio relativa a ellas)
- Bandas de Bollinger (precio en extremos de banda superior/inferior)
Muestra:
- Una puntuación porcentual de -100% a +100% (por ejemplo, "+67% TORO FUERTE")
- Barras visuales de puntos toro vs. oso (█████░░░░)
- Estadísticas de señales en curso (total de señales, confirmadas, invalidadas, % de precisión)
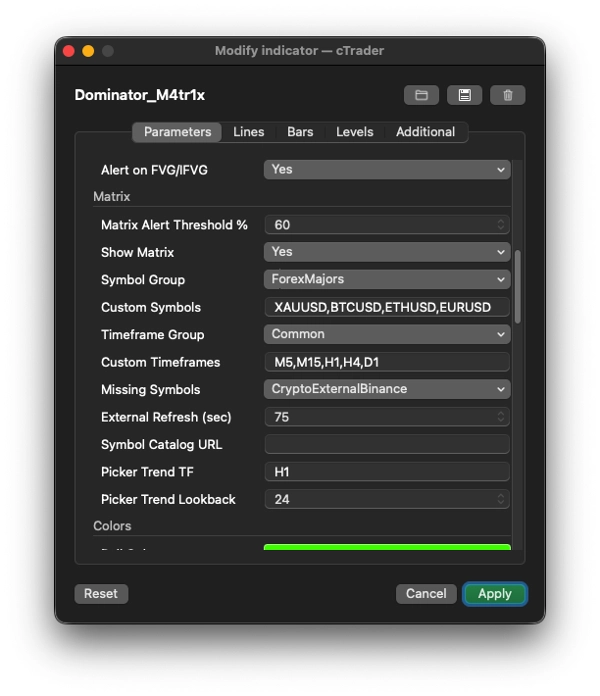
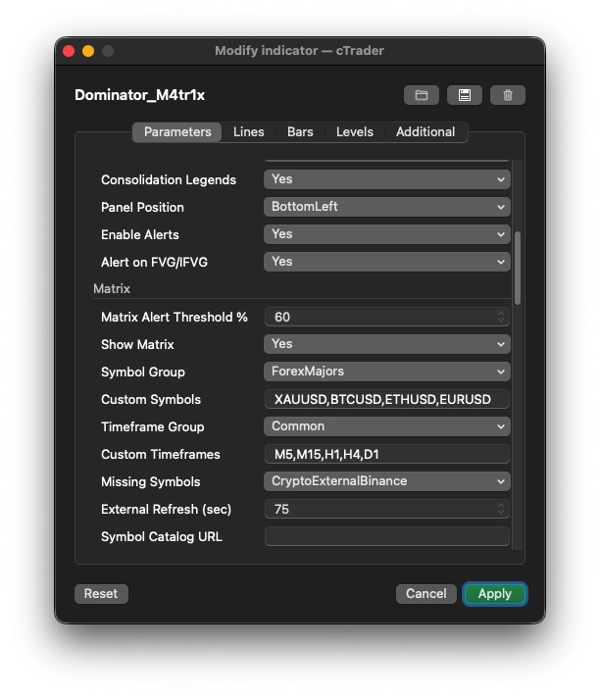
3. 🔢 MATRIZ MULTI-TIMEFRAME (panel principal)
Una rejilla/mapa de calor que muestra puntuaciones de sentimiento toro/oso a través de múltiples símbolos × múltiples marcos temporales simultáneamente.
Aspecto
Detalles
Grupos de símbolos
Forex Mayores/Menores/Exóticos, Cripto, Índices, Acciones de EE.UU., Metales, Energía, Commodities, o Personalizado
Grupos de marcos temporales
Común (M5–W1), Todos, o Personalizado
Cada celda
Muestra una puntuación codificada por colores como "+42▲" (verde) o "-67▼" (rojo) usando el mismo motor de puntuación RSI/MACD/EMA/BB
Resolución de símbolos
Extremadamente robusta — detecta automáticamente las convenciones de nombres del broker (sufijos como .r, m, .cash, barras como EUR/USD), prueba docenas de permutaciones de alias, almacena resultados en caché
Datos externos
Para símbolos que el broker no ofrece (especialmente cripto), obtiene datos OHLC de Binance, Bybit, OKX, Kraken, Bitfinex APIs (gratis, sin necesidad de clave)
APIs Premium
Opcionalmente soporta TwelveData, AlphaVantage, Polygon, Stooq para acciones/índices/forex vía claves API
Interactivo
Haz clic en cualquier nombre de símbolo → abre un selector de símbolos buscable con más de 100 símbolos en todas las categorías, mostrando el cambio % en 24h. Haz clic en cualquier encabezado de marco temporal → abre un selector de marco temporal para cambiar columnas
Alertas
Cuando cualquier celda supera un umbral configurable (por ejemplo, ±60%), reproduce un sonido de alerta
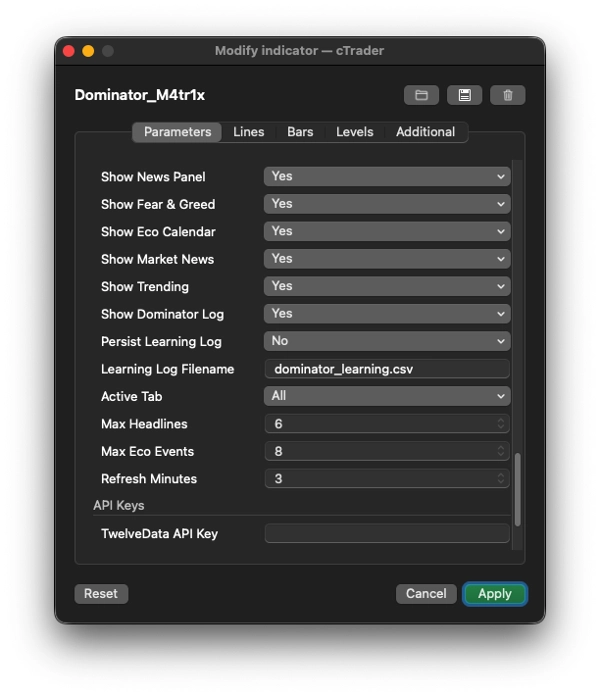
4. 📰 PANELES DE NOTICIAS + INFORMACIÓN
Calendario Económico
Agrega eventos económicos próximos de alto/medio impacto de más de 8 fuentes redundantes:
- ForexFactory (JSON + XML), TradingView, Finnhub, TradingEconomics, MQL5, FXStreet, FMP (FinancialModelingPrep)
- Codificado por colores según urgencia (rojo = AHORA, naranja = <15 min, amarillo = <1 hora, verde = más tarde)
Titulares de Noticias del Mercado
Agrega de más de 12 fuentes RSS/API:
- Cripto: CryptoCompare, CoinDesk, CoinTelegraph, NewsBTC, anuncios de Binance, estado del sistema OKX
- Forex: FXStreet, ForexLive
- Índices/Acciones: MarketWatch, CNBC, Reuters, Yahoo Finance
- Categoriza automáticamente titulares (cripto/forex/metales/energía/acciones) por detección de palabras clave
- Filtrable por pestaña (Todas, Forex, Cripto, Metales, Índices, Acciones, Energía, Económico)
Índice de Miedo y Codicia
- Obtiene el Índice de Miedo y Codicia Cripto (API alternative.me, con respaldo de CNN Business)
- Muestra valor numérico (0–100), etiqueta (Miedo Extremo → Codicia Extrema), barra de color, y historial de línea de chispa de 7 días (▁▂▃▄▅▆▇█)
Tendencias
- Obtiene los principales movimientos cripto del ticker de 24h de Binance (top 5 ganadores + top 5 perdedores)
- Recurre a CoinGecko trending o CoinPaprika
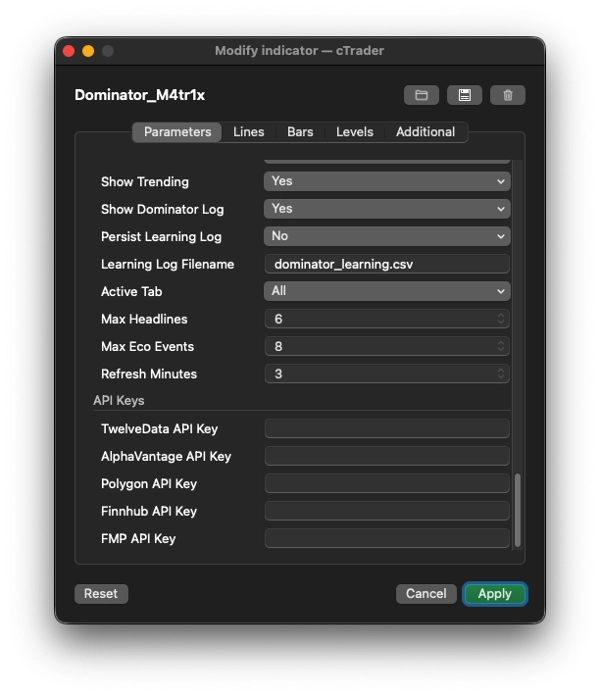
5. 📝 REGISTRO DOMINATOR + SISTEMA DE APRENDIZAJE
- Mantiene un registro de señales mostrando las últimas 8 señales con estado (● activo, ✓ confirmado, ✗ invalidado)
- Rastrea estadísticas generales de precisión (total de señales, confirmaciones, invalidaciones, % de precisión)
- Persistencia CSV opcional: escribe cada evento de señal (nuevo/confirmar/invalidar) en un archivo CSV (
dominator_learning.csv) con metadatos completos — diseñado para alimentar futuros aprendizajes automáticos o backtesting
6. 🛠 Aspectos destacados de la arquitectura técnica
- Superposición completa (
IsOverlay = true) — dibuja en el gráfico de precios, no en un panel separado - AccessRights = None — se ejecuta en el sandbox del broker (sin acceso al sistema de archivos / red más allá de lo que permite cAlgo)
- Obtención de datos asincrónica — todas las llamadas HTTP se ejecutan en hilos de fondo vía
Task.Run()para nunca bloquear el gráfico - Caché inteligente — la resolución de símbolos, datos OHLC externos, precios de ticker y porcentajes de tendencia se almacenan en caché con intervalos de actualización configurables
- Reintento automático — las resoluciones de símbolos fallidas y las obtenciones de datos externos se reintentan cada 45 segundos
- Secciones colapsables — cada sección del panel (Matriz, Miedo y Codicia, Noticias, Tendencias, Registro) puede colapsarse/expandirse haciendo clic en su encabezado
En resumen
Dominator M4tr1x es un indicador informativo que reemplaza un tablero completo de trading. Mapea la estructura del dinero inteligente en el gráfico (BOS, CHoCH, FVGs, barridos, consolidación), puntúa el sentimiento multi-activo/multi-marco temporal mediante indicadores técnicos, agrega calendarios económicos y noticias del mercado de más de 20 fuentes, rastrea Miedo y Codicia, muestra activos en tendencia, registra todas sus propias señales con seguimiento de precisión, y permite intercambiar símbolos y marcos temporales de forma interactiva — todo mientras obtiene datos faltantes de más de 5 APIs externas de intercambio en segundo plano.
5 | 0 % | |
4 | 100 % | |
3 | 0 % | |
2 | 0 % | |
1 | 0 % |


