

คำอธิบาย
วิธีการทำงานของ SMCIndicator และวิธีการใช้งาน:
1. ข้อมูลตลาด & เงื่อนไขที่วิเคราะห์
ตัวบ่งชี้นี้วิเคราะห์เฉพาะ Price Action ดิบ (เปิด, สูง, ต่ำ, ปิด) และความผันผวนในอดีตเพื่อวางแผนแนวคิด Smart Money Concepts (SMC):
- จุดสวิง (Fractals): มันสแกนหาจุดสูงสุด (สูง) และจุดต่ำสุด (ต่ำ) ในท้องถิ่นโดยการเปรียบเทียบแท่งเทียนปัจจุบันกับจำนวนแท่งเทียนในอดีตและอนาคตที่กำหนดไว้
- โครงสร้างตลาด: มันตรวจสอบราคาปิดเพื่อดูว่าทะลุผ่านจุดสูง/ต่ำที่ได้รับการยืนยันก่อนหน้านี้หรือไม่
- โมเมนตัม (การเคลื่อนที่): มันคำนวณช่วงเฉลี่ยของ 10 แท่งเทียนล่าสุดและใช้ Average True Range (ATR) เพื่อตรวจจับแท่งเทียนที่แข็งแกร่งผิดปกติ (ความไม่สมดุล) ที่ทิ้งช่องว่างไว้เบื้องหลัง
2. วิธีการตีความภาพและสัญญาณ
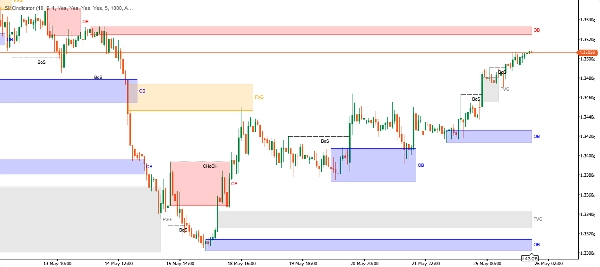
- เส้นโครงสร้างตลาด (BoS & CHoCH):
-
- BoS (Break of Structure): เส้นประที่บ่งบอกถึงการ ต่อเนื่องของแนวโน้ม ราคาได้ทะลุจุดสูง/ต่ำก่อนหน้าในทิศทางเดียวกับแนวโน้มปัจจุบัน
- CHoCH (Change of Character): เส้นจุดที่บ่งบอกถึงการ กลับตัวของแนวโน้ม ราคาได้ทะลุจุดโครงสร้างในทิศทางตรงกันข้ามกับแนวโน้มปัจจุบัน
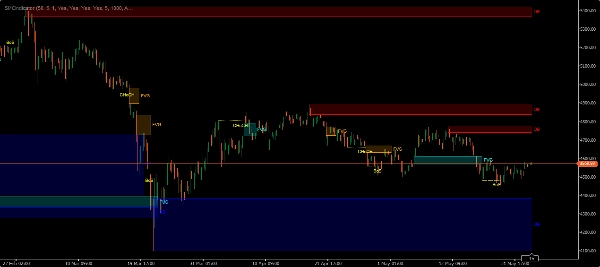
- Order Blocks (OB): สี่เหลี่ยมสี (เช่น สีน้ำเงินสำหรับ Bullish, สีแดงสำหรับ Bearish) ที่ปรากฏเมื่อเกิด BoS หรือ CHoCH พวกมันเน้นต้นกำเนิดของการเคลื่อนไหวที่ทำให้เกิดการแตกโครงสร้าง
- Fair Value Gaps (FVG): สี่เหลี่ยมสี (เช่น สีฟ้าสำหรับ Bullish, สีส้มสำหรับ Bearish) ที่บ่งบอกถึงความไม่สมดุลที่ราคาขยับเร็วเกินไป ทิ้งช่องว่างระหว่างไส้เทียนแท่งที่ 1 และ 3 ในลำดับแท่งเทียน 3 แท่ง
- Mitigation (โซนที่หยุด): เมื่อราคาสัมผัสโซน จะถือว่า "ได้รับการบรรเทา" (ทดสอบ) โซนจะหยุดขยายตัวในแนวนอน แสดงว่าโซนนั้นถูกใช้งานและมีแนวโน้มที่จะไม่สามารถรองรับการเคลื่อนไหวของราคาในอนาคตได้
3. พารามิเตอร์หลัก & การตั้งค่า
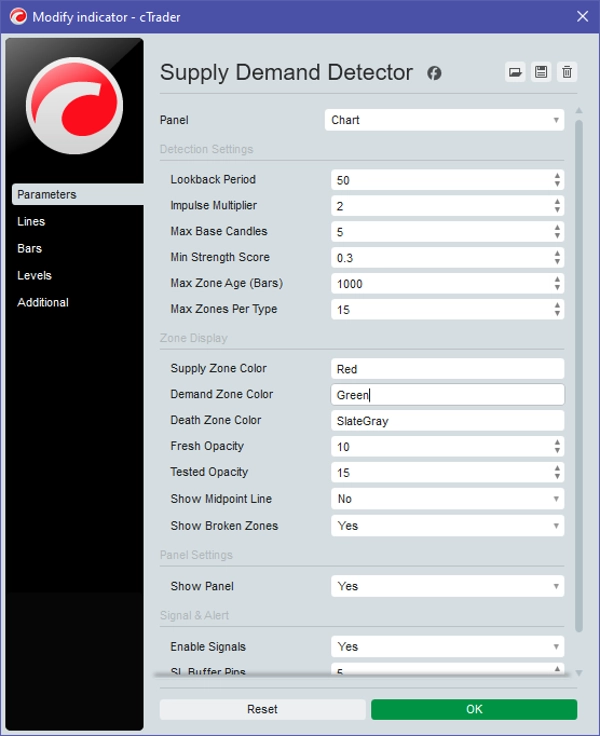
- แท่งเทียนซ้าย/ขวาของ Fractal: ควบคุมความไวของจุดโครงสร้าง ค่าที่สูงกว่า (เช่น 50/10) ระบุจุดสวิงหลักระดับมหภาค ค่าที่ต่ำกว่า (เช่น 10/3) วางแผนโครงสร้างระดับจุลภาคระยะสั้น
- ตัวกรอง FVG ATR: ปรับความเข้มงวดของการตรวจจับ FVG ค่าสูงกว่าต้องการช่องว่างที่ใหญ่และรุนแรงกว่ามากเพื่อสร้างโซน กรอง FVG ที่มีความน่าจะเป็นต่ำออก
- การขยาย Mitigation (แท่งเทียน): กำหนดระยะทางที่โซนจะขยายต่อไป หลังจาก ที่ราคาสัมผัสโซน ช่วยให้คุณเห็นแท่งเทียนที่ทดสอบโซนอย่างชัดเจน
- การจัดการหน่วยความจำ (แท่งเทียนสูงสุดในอดีต & โหมดล้างข้อมูล): ลบโซนเก่าหรือโซนที่ถูกทดสอบออกจากกราฟโดยอัตโนมัติหลังจากเวลาที่กำหนดไว้เพื่อป้องกันความยุ่งเหยิงทางสายตาและประหยัดหน่วยความจำคอมพิวเตอร์
4. กรณีการใช้งานทั่วไป & สถานการณ์การเทรด
- การตั้งค่าต่อเนื่องแนวโน้ม: 1. ระบุแนวโน้มขาขึ้นที่มีเส้น BoS 2. รอให้ราคาย่อตัว (รีเทรซ) เข้าสู่ Bullish OB หรือ Bullish FVG ที่เพิ่งก่อตัว 3. เข้าตำแหน่งซื้อเมื่อมีปฏิกิริยาขาขึ้นภายในโซน โดยตั้งเป้าหมายที่จุดสูงถัดไป
- การตั้งค่ากลับตัว:
-
- มองหา CHoCH (เช่น ราคาทำจุดสูงใหม่แล้วจู่ๆ ทะลุต่ำกว่าจุดต่ำสุดที่ยืนยันล่าสุด)
- รอให้ราคาย่อตัวขึ้นไปยัง Bearish OB หรือ FVG ที่เป็นจุดเริ่มต้นของ CHoCH
- เข้าตำแหน่งขาย คาดการณ์แนวโน้มขาลงใหม่
5. เหมาะสำหรับใคร?
- เทรดเดอร์ Price Action & SMC: เทรดเดอร์ที่พึ่งพาโครงสร้างตลาด สภาพคล่อง และความไม่สมดุลของอุปสงค์/อุปทาน แทนที่จะใช้ตัวชี้วัดที่ล่าช้า (เช่น RSI หรือ MACD)
- เทรดเดอร์รายวัน & สวิงเทรดเดอร์: มีประสิทธิภาพสูงในทุกกรอบเวลา (M15, H1, H4, Daily) ขึ้นอยู่กับการตั้งค่า fractal ที่ใช้
6. ข้อจำกัด / หมายเหตุการใช้งานที่สำคัญ
- ความล่าช้าของ Fractal (ไม่มีการวาดซ้ำ แต่ล่าช้า): เนื่องจากตัวบ่งชี้ต้องการ
RightBarsเพื่อยืนยันจุดสูง/ต่ำ การแตกโครงสร้าง (BoS/CHoCH) จะได้รับการยืนยันทางคณิตศาสตร์ หลังจาก แท่งเทียนเหล่านั้นปิด คุณต้องรอยืนยันจริง - ไม่ใช่ระบบอิสระ: การที่โซนถูกแตะไม่ใช่สัญญาณซื้อ/ขายโดยตรง โซนทำหน้าที่เป็นพื้นที่ที่มีความน่าจะเป็นสูง (AOI) คุณควรรวมกับบริบทกรอบเวลาที่สูงกว่าและทริกเกอร์เข้าตำแหน่งในกรอบเวลาที่ต่ำกว่า
- การยกเลิกโซน: หากตัวแท่งเทียนปิดตัวเต็มที่ผ่าน OB หรือ FVG โซนนั้นมักจะถือว่าเป็นโมฆะ/ล้มเหลว
สรุป
AI summary
SMCIndicator is a trading indicator that analyzes raw price action data—Open, High, Low, Close—and historical volatility to identify Smart Money Concepts (SMC) such as market structure shifts and key price zones. It detects swing points by comparing current candles to surrounding bars, monitors market structure through break of previous highs or lows, and calculates momentum using Average True Range (ATR) to highlight imbalances.
The indicator visually marks market structure lines: Break of Structure (BoS) for trend continuation and Change of Character (CHoCH) for potential reversals. It highlights Order Blocks (OB) and Fair Value Gaps (FVG) as colored zones representing origins of moves or price imbalances. Zones are considered mitigated once price tests them, which stops their horizontal extension.
Key adjustable parameters include fractal sensitivity for swing point detection, FVG ATR filter for gap strictness, mitigation extension for zone visibility after retests, and memory management to remove old zones.
Typical use cases involve identifying trend continuation setups by entering trades on pullbacks into bullish or bearish zones, and reversal setups by spotting CHoCH signals followed by price retesting relevant zones. The indicator suits price action and SMC traders across multiple timeframes, including day and swing trading. It requires confirmation after candle closes and should be combined with other analysis tools rather than used standalone.
The indicator visually marks market structure lines: Break of Structure (BoS) for trend continuation and Change of Character (CHoCH) for potential reversals. It highlights Order Blocks (OB) and Fair Value Gaps (FVG) as colored zones representing origins of moves or price imbalances. Zones are considered mitigated once price tests them, which stops their horizontal extension.
Key adjustable parameters include fractal sensitivity for swing point detection, FVG ATR filter for gap strictness, mitigation extension for zone visibility after retests, and memory management to remove old zones.
Typical use cases involve identifying trend continuation setups by entering trades on pullbacks into bullish or bearish zones, and reversal setups by spotting CHoCH signals followed by price retesting relevant zones. The indicator suits price action and SMC traders across multiple timeframes, including day and swing trading. It requires confirmation after candle closes and should be combined with other analysis tools rather than used standalone.
โปรไฟล์อินดิเคเตอร์
หมวดหมู่อินดิเคเตอร์
โครงสร้างตลาด (SMC)
ประเภทเอาต์พุต
การแสดงเป็นภาพ
ข้อกำหนดด้านข้อมูล
แท่งเท่านั้น
สัญญาณที่รองรับ
Reversal
ความแข็งแกร่งของแนวโน้ม
เบรก Level ที่ระบุ
แตะ Level ที่ระบุ
รีวิวจากลูกค้า
0.0
รีวิว: 0
รีวิวจากลูกค้า
ยังไม่มีรีวิวสำหรับผลิตภัณฑ์นี้ หากเคยลองแล้ว ขอเชิญมาเป็นคนแรกที่บอกคนอื่น!
การสนทนา
คำถามที่พบบ่อย
Fair Value Gap
BOS
Order Block
CHOCH
Market Structure
ผลิตภัณฑ์ที่มีให้บริการผ่าน cTrader Store รวมถึงบอทการเทรด อินดิเคเตอร์ และปลั๊กอิน มีให้บริการโดยนักพัฒนาบุคคลที่สามและมีไว้เพื่อวัตถุประสงค์ในการเข้าถึงข้อมูลและทางเทคนิคเท่านั้น cTrader Store ไม่ใช่โบรกเกอร์และไม่ได้ให้คำแนะนำการลงทุน คำแนะนำส่วนบุคคล หรือการรับประกันผลการดำเนินงานในอนาคต
เพิ่มเติมจากผู้เขียนคนนี้





!["[Stellar Strategies] MARSI Signal Plotter" โลโก้](https://cdn.ctrader.com/image/webp/7b2b8da6-8f8e-4646-8d4a-4710c516c01e_25567)














ราคา

ตั้งแต่ 13/05/2026
1
ติดตั้งฟรี