Descripción
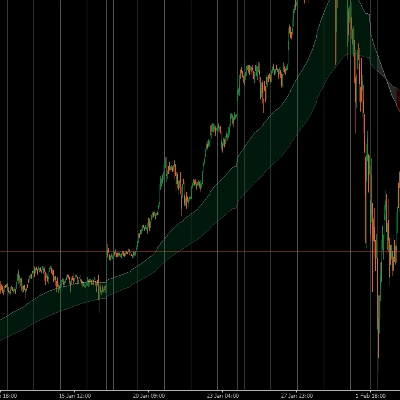
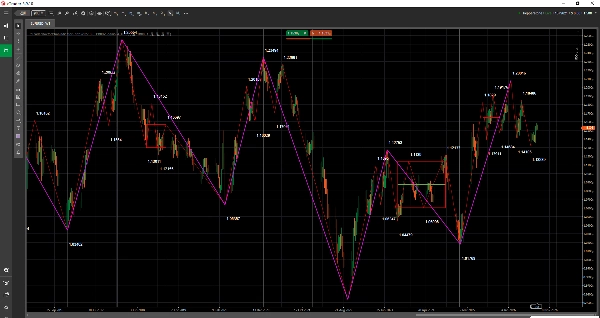
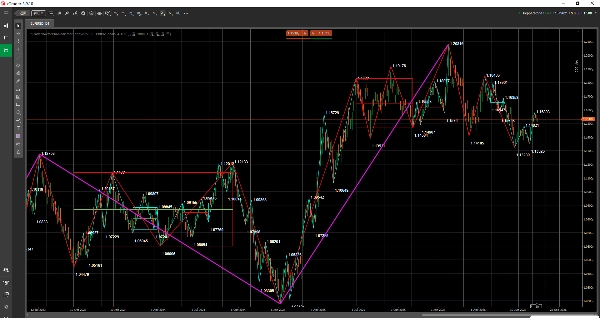
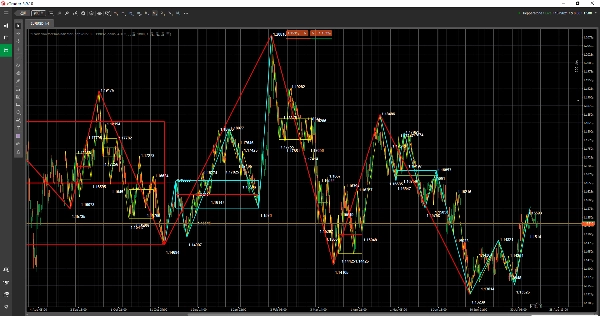
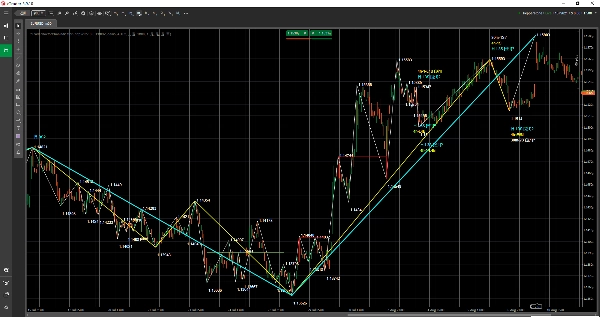
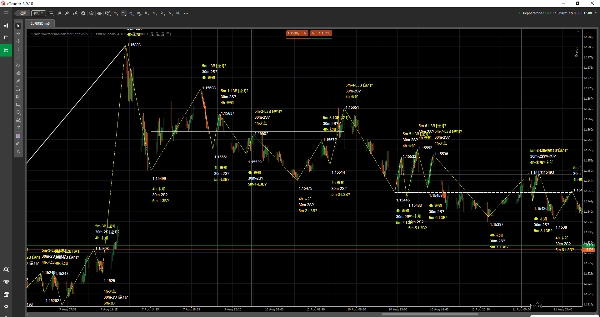
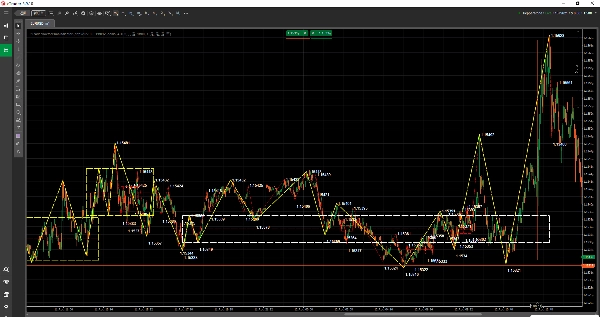
El Indicador de la Teoría del Dr. Chan para cTrader es un indicador de análisis técnico de estructura de mercado / superposición de gráficos utilizado para mostrar las estructuras de la Teoría del Dr. Chan en los gráficos de cTrader.
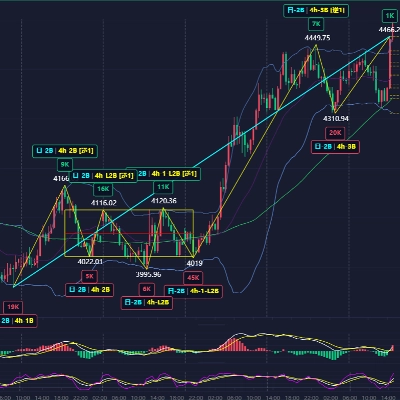
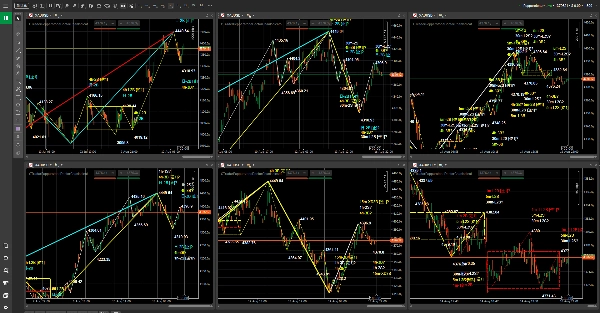
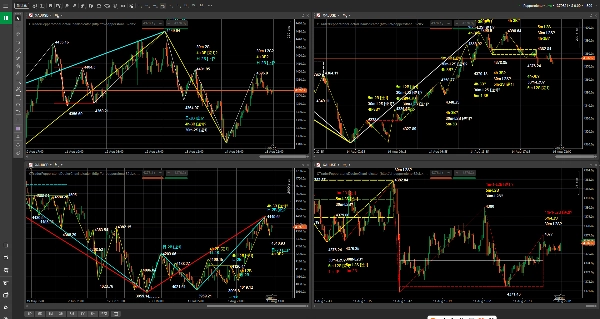
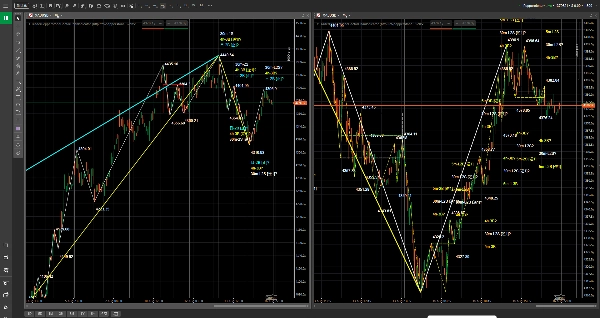
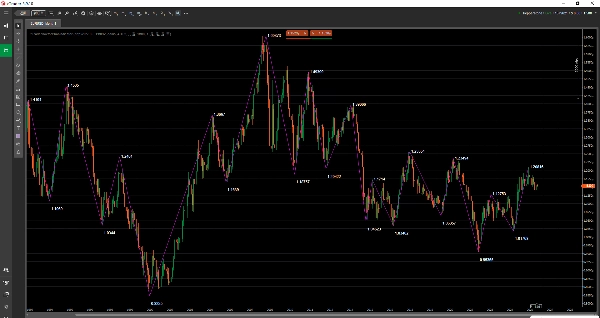
Es adecuado para traders que se centran en la acción del precio, la estructura de la tendencia y el análisis multitemporal. El indicador muestra las estructuras clave de la Teoría del Dr. Chan como objetos en el gráfico, incluyendo estructuras Bi, zonas Zhongshu, marcadores de compra/venta y más, ayudando a los usuarios a observar el ritmo del mercado, los cambios estructurales y las relaciones entre diferentes marcos temporales de manera más intuitiva.
Este indicador no es un robot de trading automatizado ni un servicio de señales de trading. Su propósito es ayudar a los usuarios a leer gráficos, revisar mercados y construir planes de trading con mayor claridad.
La versión actual es compatible con símbolos y marcos temporales específicos de Pepperstone cTrader. Este producto es un indicador independiente de terceros y no es un producto oficial de Pepperstone ni un producto asociado a Pepperstone.
Resumen del indicador
- Tipo de indicador: indicador de estructura de mercado / superposición de gráficos.
- Instrumentos preferidos: símbolos específicos de Forex, índices, materias primas, criptomonedas y CFDs de acciones en Pepperstone cTrader.
- Marcos temporales preferidos: 1 minuto, 5 minutos, 15 minutos, 30 minutos, 1 hora, 4 horas, diario, semanal y mensual.
- Caso de uso para trading: observación de la estructura del gráfico, análisis multitemporal, preparación y apoyo para la revisión de planes de trading.
Lo que puedes ver en el gráfico
- Estructuras Bi: utilizadas para observar el ritmo del swing y la progresión estructural.
- Zonas Zhongshu: utilizadas para observar áreas importantes de consolidación, equilibrio y superposición estructural.
- Marcadores de compra/venta: usados para ayudar a localizar puntos clave de referencia estructural.
- Etiquetas de texto, líneas horizontales, líneas verticales, áreas rectangulares, líneas de tendencia y otros objetos del gráfico.
- Se soporta por defecto la coincidencia automática de datos con el marco temporal actual del gráfico, facilitando la observación multitemporal.
Para quién es este indicador
- Usuarios que están aprendiendo o usando la Teoría del Dr. Chan y el análisis de estructura de la Teoría del Chan.
- Usuarios que desean ver la información estructural directamente en los gráficos de cTrader.
- Usuarios que utilizan Pepperstone para ver Forex, índices, materias primas, criptomonedas o CFDs de acciones.
- Traders que necesitan comparar estructuras de tendencia en diferentes marcos temporales.
- Usuarios que desean hacer más claros los flujos de trabajo de lectura de gráficos, planificación y revisión.
Acceso y licencias
El acceso al producto y las licencias se gestionan a través del proceso de compra, prueba e instalación en la tienda cTrader. Por favor, consulte el estado de compra, estado de prueba e información del producto mostrados en la página del producto en la tienda cTrader.
Símbolos de Pepperstone actualmente soportados
Forex:
GBPUSD, EURUSD, USDJPY, USDCHF, AUDUSD, USDCAD, GBPJPY
Índices:
US500, NAS100, GER40, UK100, JPN225, VIX, HSTECH
Materias primas:
XAUUSD, XAGUSD
Criptomonedas:
BTCUSD, ETHUSD
Acciones:
AAPL.US-24, MSFT.US-24, GOOG.US-24, AMZN.US-24, TSLA.US-24, NVDA.US-24, META.US-24, NFLX.US-24, JPM.US-24
Marcos temporales soportados
1 minuto, 5 minutos, 15 minutos, 30 minutos, 1 hora, 4 horas, diario, semanal y mensual.
Flujo de trabajo sugerido
1. Abre un gráfico para un símbolo soportado en el entorno Pepperstone cTrader.
2. Carga el Indicador de la Teoría del Dr. Chan en el gráfico.
3. El tiempo de los datos del Indicador de la Teoría del Dr. Chan es UTC+0. Al revisar las estructuras del gráfico, asegúrate de cambiar la zona horaria del gráfico de cTrader a la zona horaria correspondiente antes de comparar posiciones.
4. Asegúrate de que el marco temporal actual del gráfico esté soportado. El indicador ajusta automáticamente los datos al marco temporal del gráfico.
5. Activa o desactiva "Mostrar Bi", "Mostrar Zhongshu" y "Mostrar Compra/Venta" según sea necesario.
6. Observa la estructura del gráfico junto con tu propio plan de trading, gestión de posiciones y control de riesgos.
Configuración de parámetros
La versión actual expone solo los siguientes 3 parámetros visibles en el panel del indicador de cTrader. El marco temporal de datos, sufijo del símbolo del broker, caché, actualización, transferencia comprimida y configuración de registro se gestionan internamente por el indicador y no necesitan configurarse para un uso normal.
Mostrar Bi
Valor predeterminado: "true"
Indica si se muestran las estructuras Bi.
Mostrar Zhongshu
Valor predeterminado: "true"
Indica si se muestran las zonas Zhongshu.
Mostrar Compra/Venta
Valor predeterminado: "true"
Indica si se muestran los marcadores de compra/venta.
Notas importantes
- Este producto es un indicador asistente de análisis técnico, no un robot de trading automatizado.
- El indicador no realiza órdenes automáticamente.
- El indicador no constituye asesoramiento de inversión, un servicio de señales de trading ni una garantía de ganancias.
- La versión actual es compatible solo con símbolos y marcos temporales específicos de Pepperstone cTrader.
- El tiempo de los datos del Indicador de la Teoría del Dr. Chan es UTC+0. Al mostrarlo en un gráfico de cTrader, por favor cambia a la zona horaria correspondiente del gráfico antes de verificar las posiciones estructurales.
- Los usuarios deben usarlo junto con su propio plan de trading, gestión de posiciones, control de riesgos y juicio independiente.
Dirección de futuras actualizaciones
La versión actual prioriza símbolos y marcos temporales específicos de Pepperstone cTrader. Las futuras actualizaciones pueden continuar ampliando más brokers, más mapeos de símbolos y un alcance de servicio de datos más completo según el plan del producto.
Advertencia de riesgo
El trading en los mercados financieros implica riesgos. El rendimiento pasado no garantiza resultados futuros. Este indicador es solo una herramienta de análisis técnico y aprendizaje asistido. No constituye asesoramiento de inversión, un servicio de señales de trading ni una garantía de ganancias. Las estructuras históricas no representan resultados futuros. Los usuarios deben probarlo completamente en su propio entorno de trading y usarlo con precaución junto con reglas de gestión de riesgos.





![Logotipo de "[Stellar Strategies] VBO"](https://cdn.ctrader.com/image/webp/f034c012-94d4-445a-a01b-febd1cdedaef_36944)