


Descripción
Flintridge Trader Pro marca dónde el precio ya ha mostrado su intención, y luego te indica cuándo el mercado gira en esos puntos.
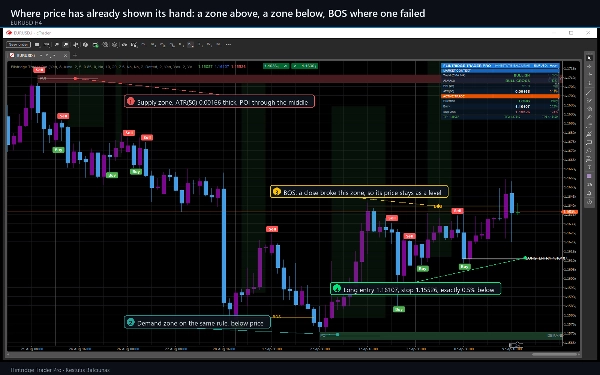
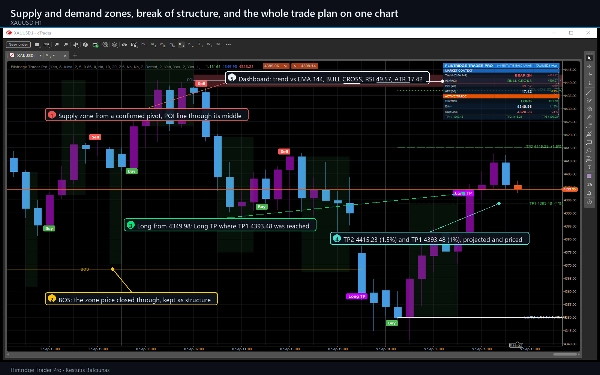
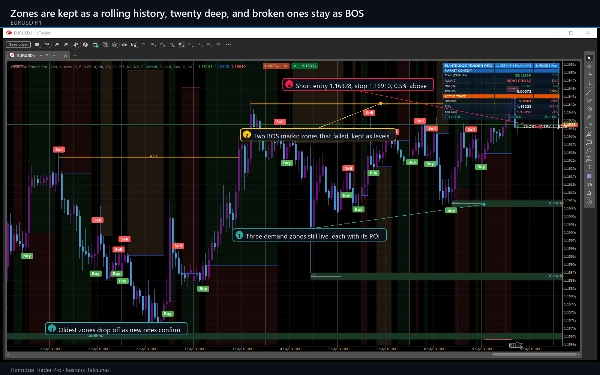
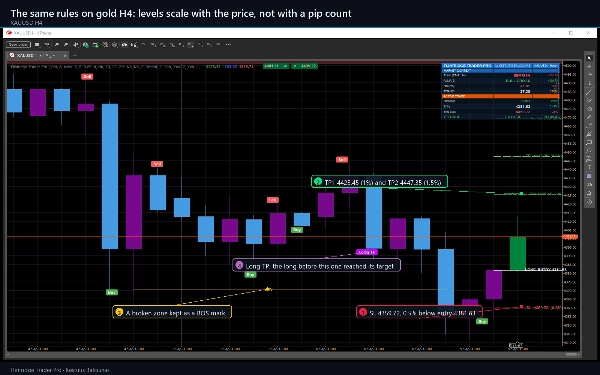
Los pivotes de oscilación confirmados construyen zonas de oferta y demanda, cada una con un grosor de ATR y su punto de interés en el medio. Cuando el precio cierra a través de una zona, se convierte en una ruptura de estructura y se marca como BOS, por lo que el nivel que falló permanece en el gráfico como información en lugar de desaparecer. Por separado, se calcula un promedio móvil de los cierres y un promedio móvil de las aperturas en un marco temporal SUPERIOR - ocho veces tu gráfico por defecto - y su cruce es la señal.
Lo que dibuja en tu gráfico
- Zonas de oferta y demanda de pivotes de oscilación confirmados, cada una con una línea POI, mantenidas como un historial continuo y convertidas en una marca BOS cuando se rompen.
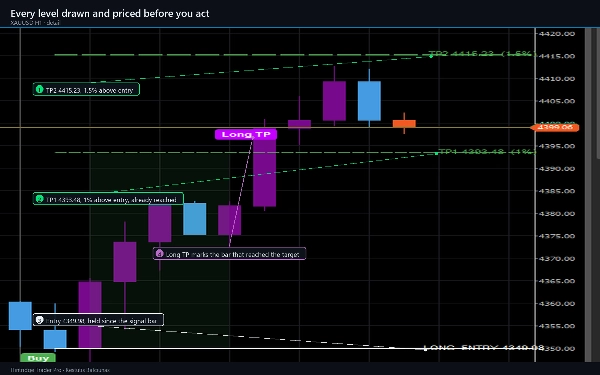
- Marcadores de Compra y Venta, y marcadores de TP y SL largos donde se alcanza un nivel.
- La entrada, el stop y el primer objetivo como líneas escalonadas, con una banda de riesgo sombreada y una banda de recompensa sombreada entre ellas.
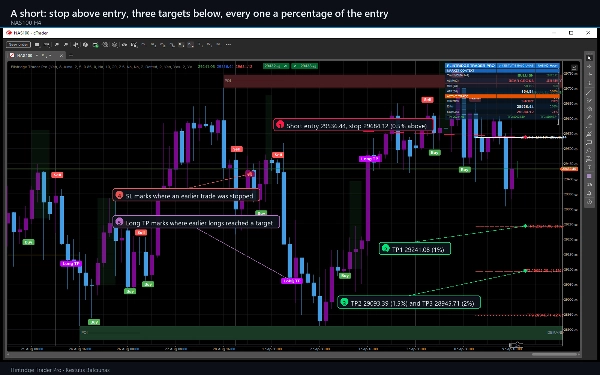
- La última señal proyectada hacia adelante, con la entrada, el stop y los tres objetivos dibujados y etiquetados con su precio y su porcentaje.
- Etiquetas opcionales de oscilación HH, LH, HL y LL, y una capa opcional de soporte y resistencia con hasta 21 niveles y sus zonas.
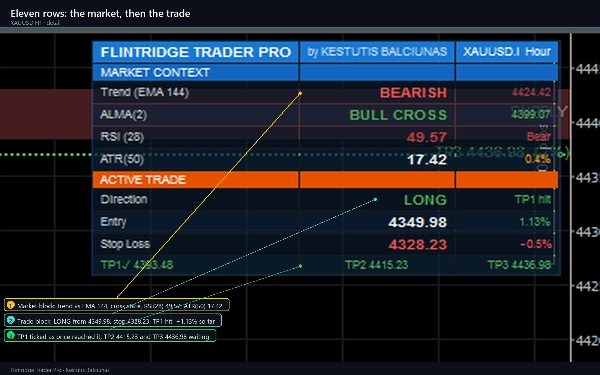
- Un panel de control de once filas: tendencia contra la EMA 144, el estado del cruce, RSI, ATR, luego la operación en vivo con su dirección, etapa, entrada, stop y tres objetivos, cada uno marcado cuando el precio lo alcanza.
- Velas recoloreadas para que la dirección de cada barra sea legible de un vistazo.
Cómo operar con él
- Dale historial. Con la configuración predeterminada necesita alrededor de 250 barras antes de que aparezca algo, y necesita suficientes datos en el marco temporal superior para que exista el primer cruce.
- Lee primero las zonas. Una compra dentro de una zona de demanda y una venta dentro de una zona de oferta son las configuraciones que la herramienta está diseñada para mostrarte.
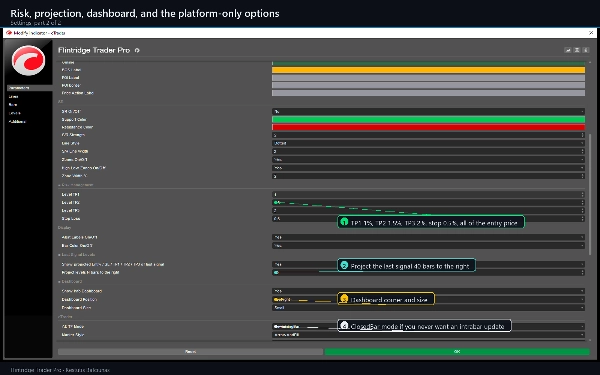
- Toma los niveles tal como están dibujados. El stop y los tres objetivos son porcentajes del precio de entrada, 0.5, 1, 1.5 y 2 por defecto, y cada uno de ellos está en el gráfico antes de que actúes.
- Usa el panel de control para contexto, no para permiso. La tendencia, el cruce, RSI y ATR describen el mercado; ninguno bloquea una señal a menos que actives los filtros opcionales.
Configuraciones que importan más
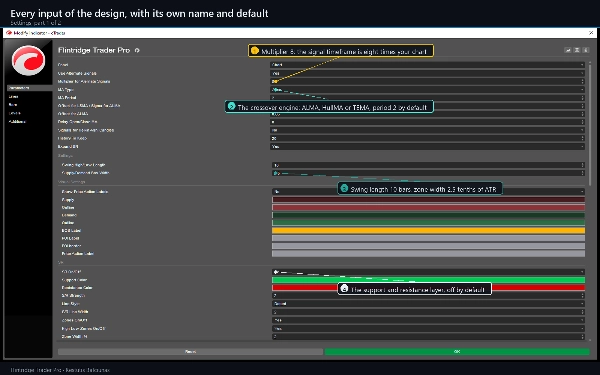
- Tipo de MA y Periodo de MA eligen el motor de cruce: ALMA, HullMA o TEMA.
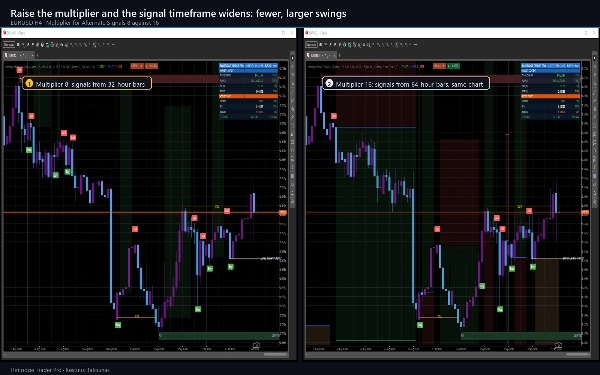
- Multiplicador para Señales Alternas establece cuánto más alto es el marco temporal de la señal respecto a tu gráfico.
- Longitud de Alto/Bajo de oscilación y Ancho de Caja de Oferta/Demanda controlan cuántas zonas obtienes y qué tan gruesas son.
- Nivel TP1, TP2, TP3 y Stop Loss son porcentajes de la entrada, y las posiciones cortas reutilizan los mismos cuatro números.
- Tres filtros opcionales - una puerta de tendencia EMA 144, una puerta RSI y un espacio mínimo entre barras para entradas - están disponibles para traders que quieren menos señales. Están DESACTIVADOS por defecto.
Dónde funciona
Cualquier símbolo y cualquier marco temporal. Fue diseñado alrededor de M15, H1 y H4, y se siente cómodo en los principales pares de forex, oro y los principales índices; también funciona en criptomonedas, donde las zonas tienden a ser más amplias porque el ATR lo es. Los marcos temporales más bajos dan muchas más señales, para lo cual están los filtros opcionales y el multiplicador de marco temporal superior para controlar.
Alertas
Doce eventos, cada uno con su propio interruptor: entradas largas y cortas, los tres objetivos para cada dirección y los stops. Van al registro de cTrader, un sonido opcional y al propio correo electrónico de cTrader. Las alertas se activan solo en barras cerradas, nunca para historial que cerró antes de que adjuntaras el indicador, y nunca dos veces para la misma barra.
Requisitos y comportamiento
cTrader 5.0 o superior, escritorio. El indicador no declara derechos de acceso: no abre conexión de red, no lee archivos y nunca coloca, modifica ni cierra una orden. Una señal se evalúa en una barra cerrada y no se mueve después. Dos cosas son provisionales mientras se forma la barra más nueva: la zona más nueva, cuyo pivote aún no está confirmado, y el valor del marco temporal superior, que se lee de la barra que contiene la actual. Se proporciona una configuración para leer la barra completada anterior del marco temporal superior en su lugar, que nunca repinta.
Este es un software analítico y nada de lo que dibuja es un consejo. Las marcas de objetivo y stop solo registran que el precio tocó un nivel dibujado en el historial cargado; no hay spread, comisión ni deslizamiento detrás de ellas y no se colocó ninguna orden.
Operar implica riesgo. El rendimiento pasado no garantiza resultados futuros.
Resumen
Key chart elements include supply and demand zones with points of interest, buy/sell markers, entry, stop loss, and three target levels displayed as stepped lines with shaded risk and reward bands. Optional swing labels (HH, LH, HL, LL) and a support/resistance layer with up to 21 levels are available. An eleven-row dashboard provides market context with trend, crossover state, RSI, ATR, and live trade details including stage, entry, stop, and targets.
Flintridge Trader Pro supports any symbol and timeframe, optimized for M15, H1, and H4 charts, and is suitable for forex majors, gold, major indices, and cryptocurrencies. It includes configurable settings for moving average type, swing length, zone width, and risk parameters. Alerts cover entries, targets, and stops, firing on closed bars only. The indicator is analytical software that does not place or manage orders.





























